Logging Setup
Lucille Logs
Lucille uses Log4j2 (via SLF4J) for all logging. A default log4j2.xml is included in lucille-core/src/main/resources/.
Using a Custom Log4j2 Configuration
To override the default logging configuration, pass the standard Log4j2 system property on the Java command line:
java -Dlog4j.configurationFile=/path/to/my-log4j2.xml \
     -Dconfig.file=my-pipeline.conf \
     -cp 'target/lib/*' \
     com.kmwllc.lucille.core.Runner
This applies to all Lucille components (Runner, Worker, Indexer, WorkerIndexer). If you don’t provide this property, Log4j2 uses whatever log4j2.xml it finds on the classpath.
Common reasons to provide a custom configuration:
- Route the DocLogger to a separate file (to avoid mixing per-document lifecycle events with operational logs)
- Enable JSON-formatted output for log aggregation tools
- Adjust log levels for specific packages (e.g., suppress noisy third-party library logging)
- Configure log rotation policies for long-running Worker/Indexer processes
There are many ways you can use the logs output by Lucille. Lucille has, essentially, two main loggers for tracking your Lucille run:
the Root logger, and the DocLogger.
The Root Logger
The Root logger outputs log statements from a variety of sources, allowing you to track your Lucille run. For example, the Root logger
is where you’ll get intermittent updates about your pipeline’s performance, warnings from Stages or Indexers in certain situations, etc.
The Doc Logger
The DocLogger is very verbose - it tracks the lifecycle of each Document in your Lucille pipeline.
For example, a log statement is made when a Document is created, before it is published, before & after a Stage operates on it… etc.
As you can imagine, this results in many log statements - it is recommended these logs are stored in a file, rather than just
having them printed to the console.
Logs from the DocLogger are at ERROR level by default. This means that without log4j2 configuration changes, only error-level document lifecycle events will appear. To capture the full document lifecycle, configure the DocLogger at INFO or DEBUG level in your log4j2.xml and route it to a file — the volume at full verbosity is high.
All document failure messages use a standardized "Document FAILED" prefix, making it straightforward to find every failed document with a single grep. Specific failure types append additional context: "Document FAILED during pipeline processing", "Document FAILED during indexing", or "Document FAILED: retry count exceeded".
MDC Fields
Lucille populates the SLF4J Mapped Diagnostic Context (MDC) so that every log line includes structured context you can filter on:
| MDC Key | Value | Description |
|---|---|---|
run_id | UUID string | The unique ID for the current run. Set at run start; present on all log lines during the run. |
id | Document ID string | The ID of the document currently being processed. Set per-document inside Workers. |
When storing logs as JSON (ECS layout), these appear as top-level fields in each log record, making it easy to filter all activity for a specific document or run.
Log Files
Lucille can store logs in a file as plain text or as JSON objects. When storing logs as JSON, each line will be a JSON object representing
a log statement in accordance with the EcsLayout. By modifying the log4j2.xml, you can control which Loggers are enabled/disabled,
where their logs get stored, and what level of logs you want to process.
Logstash & OpenSearch
If you store your logs as JSON, you can easily run Logstash on the file(s), allowing you to index them into a Search Engine of your
choice for enhanced discovery and analysis. This can be particularly informative when working with the DocLogger. For example,
you might:
- Trace a specific Document’s lifecycle by querying by the Document’s ID.
- Using the Timestamp of the logs, track the performance of your Lucille pipeline and identify potential bottlenecks.
- Create Dashboards, allowing you to monitor your pipeline for potential warnings / errors for a repeated Lucille run.
Here is an example pipeline.conf for ingesting your Lucille logs into a local OpenSearch instance:
input {
  file {
    path => "/lucille/lucille-examples/lucille-simple-csv-solr-example/log/com.kmwllc.lucille-json*"
    mode => "read"
    codec => "json"
    start_position => "beginning"
    sincedb_path => "/dev/null"
    exit_after_read => "true"
  }
}
output {
  stdout {
    codec => rubydebug
  }
  opensearch {
    hosts => "http://localhost:9200"
    index => "logs"
    ssl_certificate_verification => false
    ssl => false
  }
}
Note that this pipeline will delete the log files after they are ingested. And, SSL is disabled.
Here are some queries you might run (using curl):
curl -XGET "http://localhost:9200/logs/_search" -H 'Content-Type: application/json' -d '{
  "query": {
    "term": {
      "id.keyword": "songs.csv-1"
    }
  }
}'
This query will only return log statements where the id of the Document being processed is “songs.csv-1”, a Document ID from the Lucille Simple CSV example. This allows you to easily track the lifecycle of the Document as it was processed and published.
curl -XGET "http://localhost:9200/logs/_search" -H 'Content-Type: application/json' -d '{
  "query": {
    "match": {
      "message": "FileHandler"
    }
  }
}'
This query will return log statements with “FileHandler” in the message. This allows you to track specifically when Documents were created from a JSON, CSV, or XML FileHandler.
OpenSearch Dashboards
By filling an OpenSearch Index with your JSON log statements, you can also build OpenSearch Dashboards to monitor your Lucille runs and analyze their performance.
Setting up the Index Pattern
Once you have OpenSearch Dashboards open, click on the menu in the top left. Select Dashboards Management, and then, on this new page, select Index Patterns. Create an Index Pattern for your logs index. As you click through, be sure to choose @Timestamp in the dropdown for “Time Field”.
(Timestamps are very important in OpenSearch Dashboards. Many features will use the timestamp of a Document in some form.)
Discovery
OpenSearch Dashboards has two major “features” - Dashboards and Discover. We’ll start with Discover.
At the top right of the screen, you’ll see a time range. Only logs within this time range will be shown. It defaults to only include logs within the last 15 minutes, so you’ll likely need to change it. Set absolute time ranges that cover your Lucille run. (The UI for setting these times can be a bit finicky, but keep trying.)
Like before, we can trace the entire lifecycle of a single Document. In the search bar, type in: id:"songs.csv-1". Now, you
should only see the log statements relevant to this Document. Each entry will be a large blob of text representing the entire Document.
You can select certain fields on the left side of your screen to get a more focused view of each statement.
You can also sort the statements in a certain order. If you hover over Time at the top of the table, you can click the arrow to sort the logs by their timestamps.
Dashboards
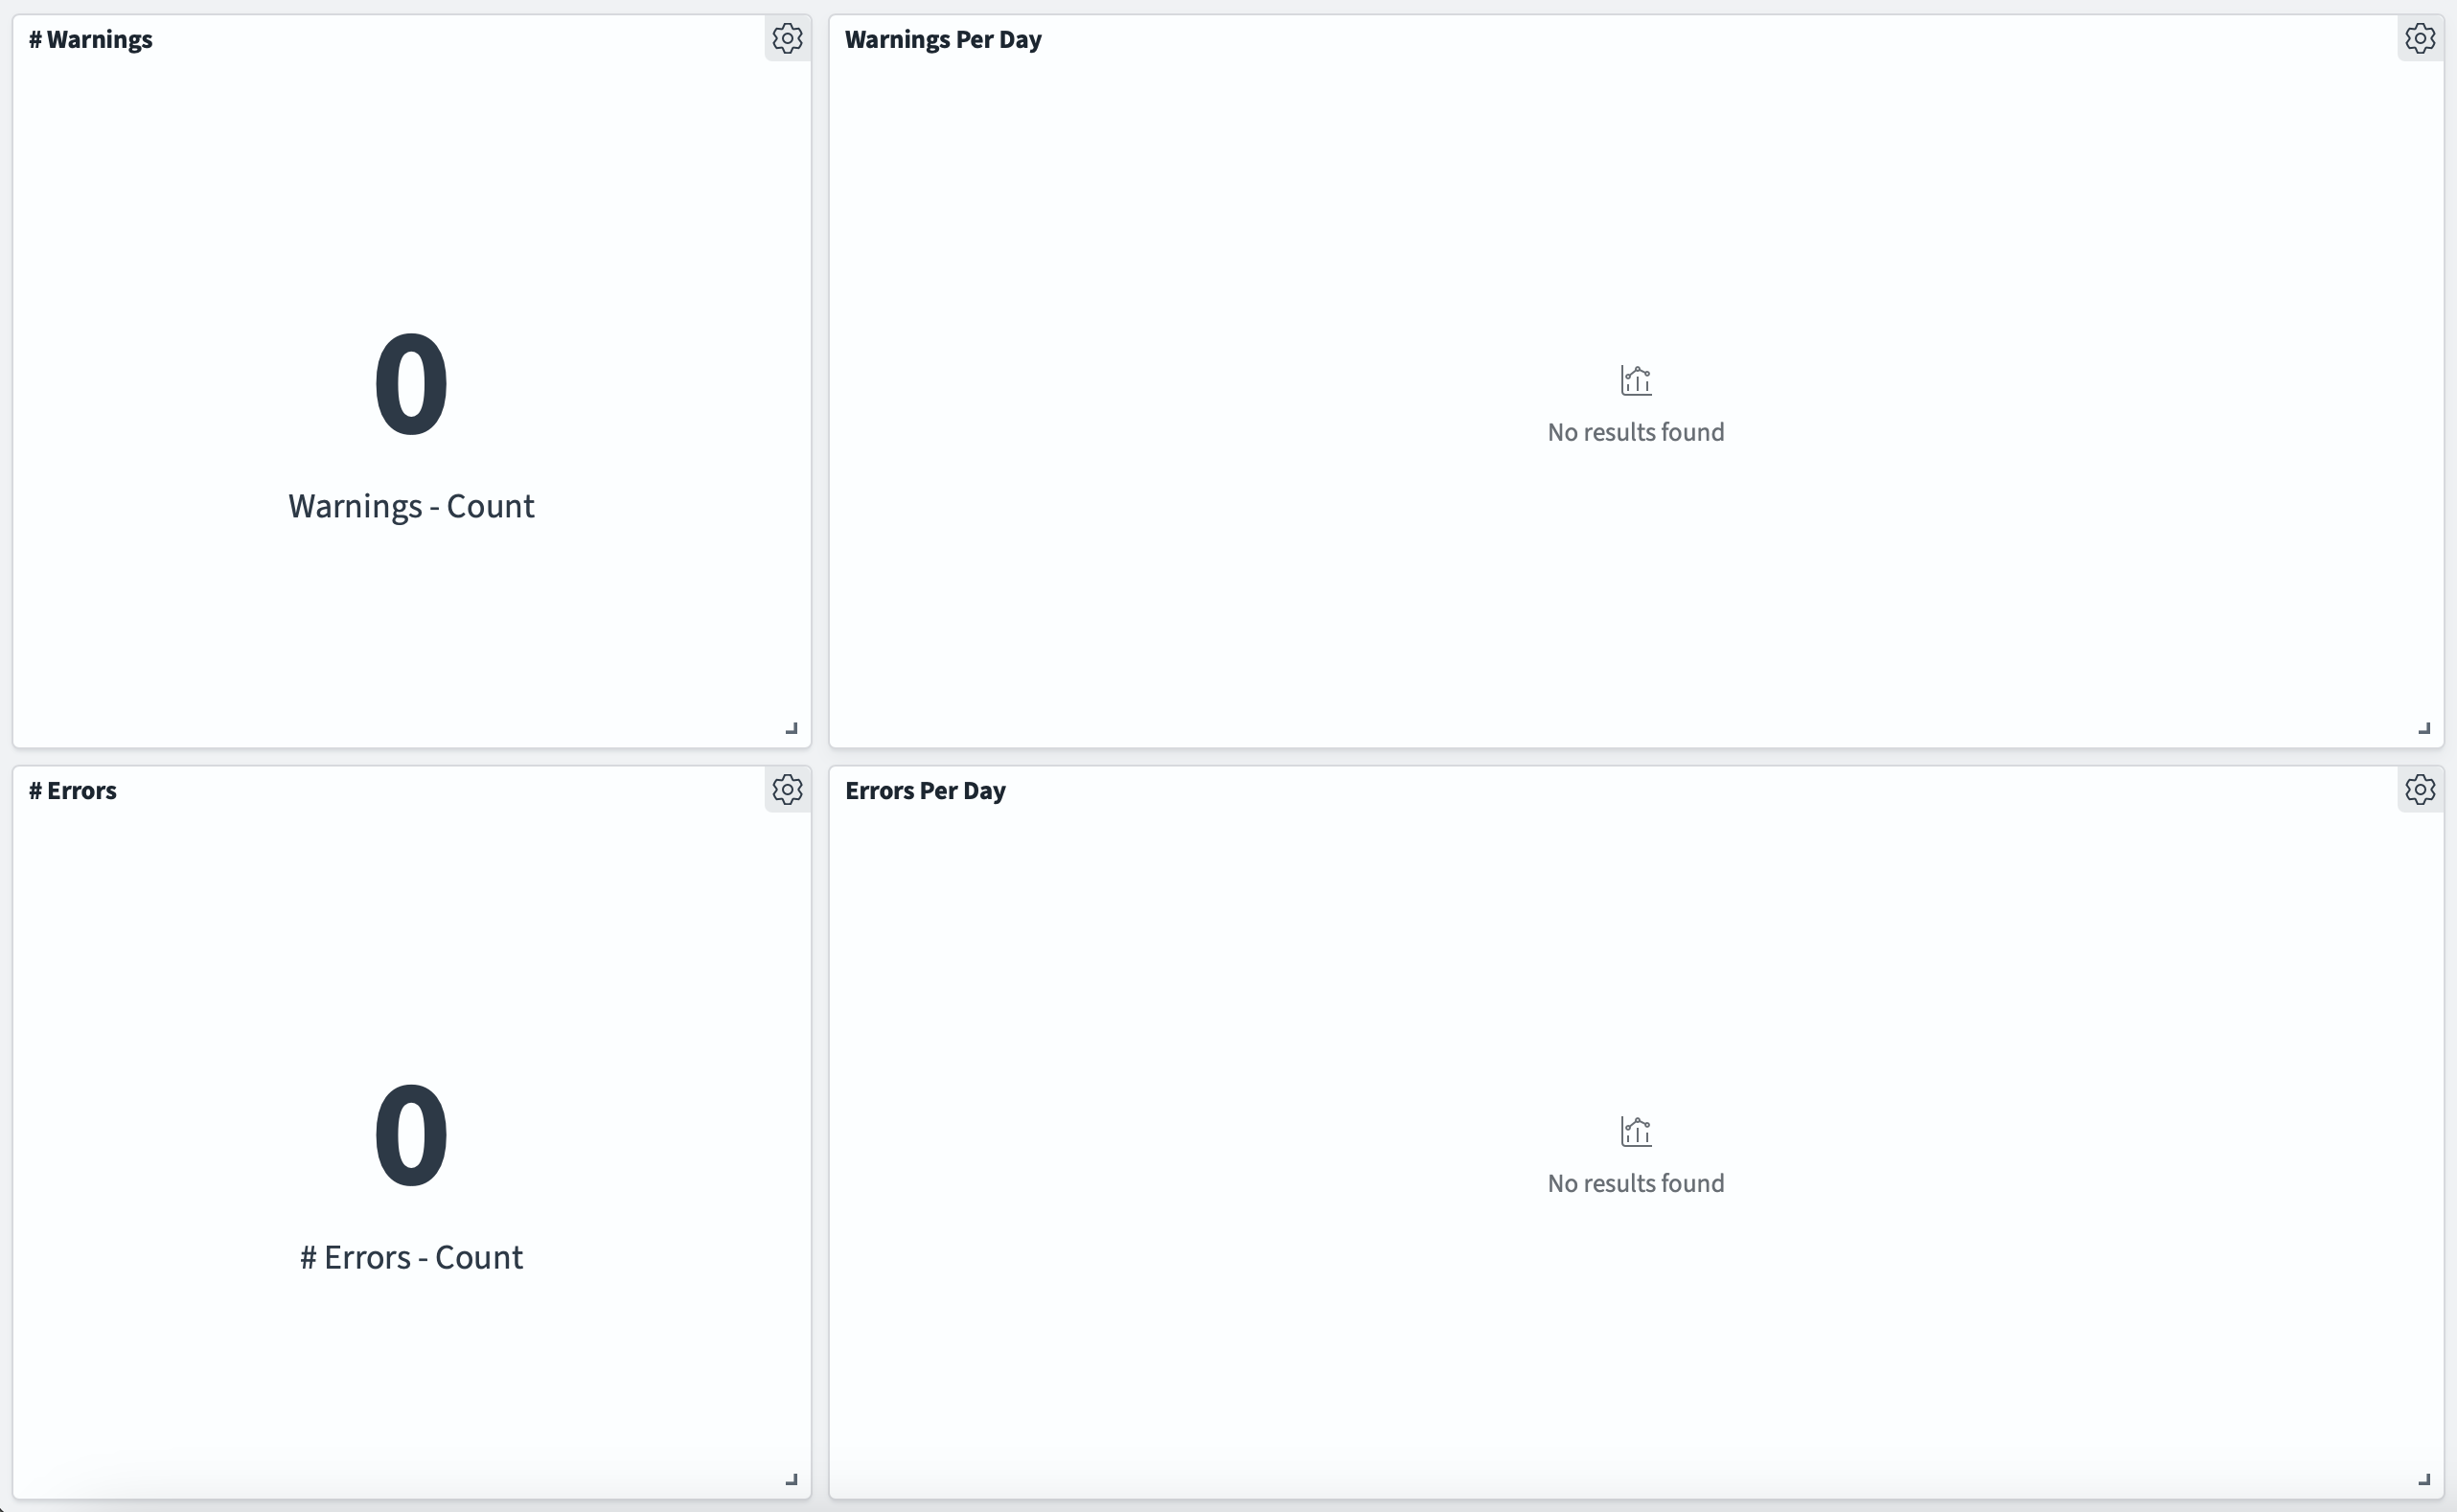
Now, let’s see how Dashboards could help you monitor a certain Lucille run. Imagine you have scheduled a Lucille run to execute every day. We can create a Dashboard that will help us quickly see how many warnings/errors took place.
Click add in the top right to create a new panel. Click + Create new, then choose visualization, and then metric. Choose your logs index as the source.
In this new window, for metric, click buckets. Choose a Filters aggregation, and in the filter, include log.level:"WARN" (using
Dashboards Query Language). This will display the number of log statements with a level of “WARN”.
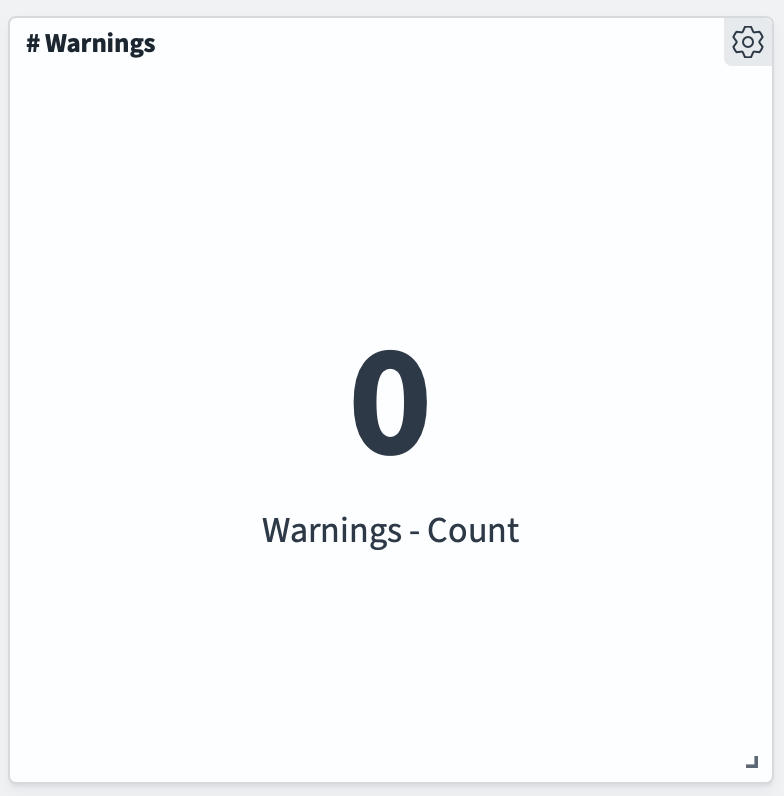
You can then repeat this process, but for logs with a level of ERROR.
Now, let’s make a chart that’ll display the number of warnings per day. Create a new visualization - this time, a vertical bar.
Go to buckets, and add X-axis. Configure it like this:
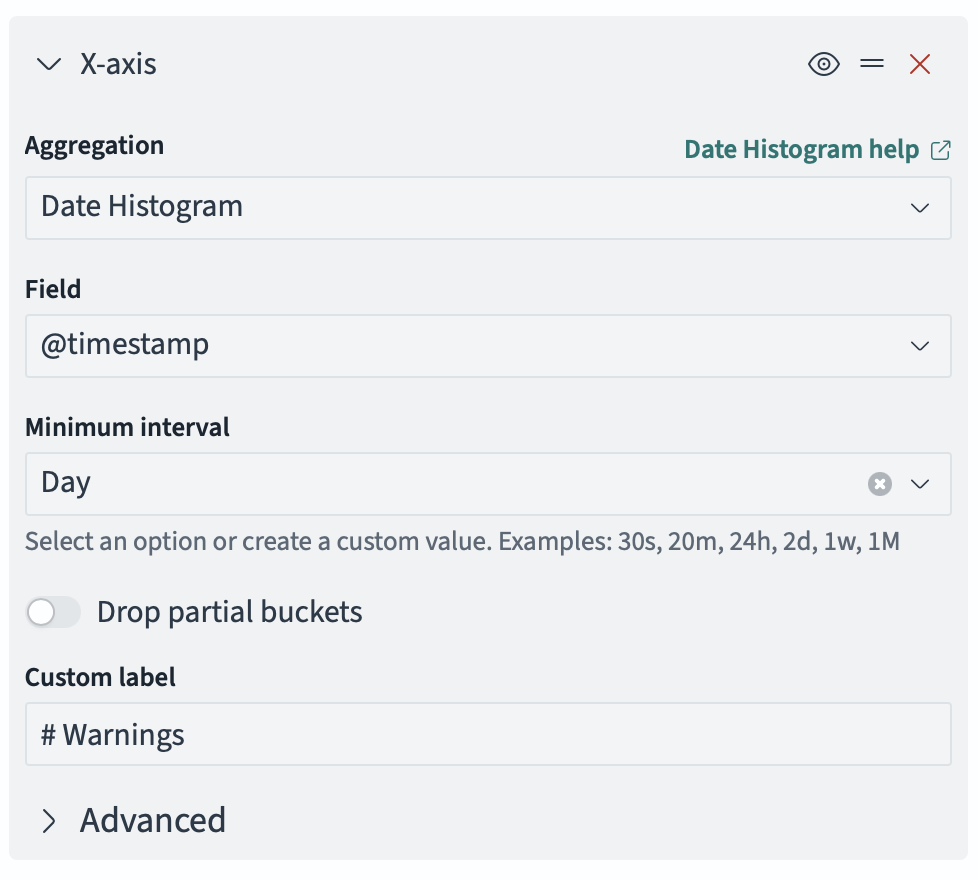
Then, add another bucket - a split series. Configure it just like the panel - a Filters aggregation, with log.level:"WARN".
Now you’ll have a chart tracking the number of warnings per day. And, again, you can do the same for ERROR-level logs.
Your dashboard might look a little something like this (but populated with a little bit of actual data):