This is the multi-page printable view of this section. Click here to print.
Operations Guide
- 1: Configuration Management
- 2: Deployment
- 2.1: Local Batch
- 2.2: Distributed Batch
- 2.3: Distributed Streaming
- 2.4: Hybrid Streaming
- 2.5: Docker Compose
- 2.6: Kubernetes
- 2.7: Production Operations
- 3: Logging Setup
- 4: Log Interpretation
- 5: Performance Tuning
- 6: Security Configuration
- 7: REST API
- 8: Support Matrix
- 9: Troubleshooting
1 - Configuration Management
This page covers the operational patterns for working with Lucille’s configuration system — how to use environment variable substitution, how to compose configs from reusable files, how to deploy configs in containers, and how to validate configs before running. For the architectural rationale behind Lucille’s choice of HOCON and the Typesafe Config library, see Architecture: Config.
Environment Variable Substitution
In containerized deployments (Docker, Kubernetes), credentials and environment-specific settings are typically provided via container environment variables or mounted secrets. A database password, an API key, a search engine URL — these should not be hardcoded in a config file that lives in version control.
Lucille handles this through HOCON’s substitution syntax:
opensearch {
  # default value in the file; overridden by env var if present
  url: "http://localhost:9200"
  url: ${?OPENSEARCH_URL}
}
The ${?OPENSEARCH_URL} syntax means: “if the environment variable OPENSEARCH_URL is set, use its value; otherwise, keep the previous value.” The second line overrides the first only when the env var is present. This is a single mechanism that handles:
- Development (use the default
localhostvalue) - CI/CD (set the env var in the test environment)
- Production containers (inject via Kubernetes secrets or Docker env vars)
No application code is involved. The config library resolves everything before any Lucille component sees it.
Configuration Patterns in Lucille
The Override Pattern for Environment-Specific Values
The most common pattern in Lucille configs is declaring a default and then overriding it with an optional environment variable:
opensearch {
  url: "http://localhost:9200"
  url: ${?OPENSEARCH_URL}

  index: "my-index"
  index: ${?OPENSEARCH_INDEX}
}
In HOCON, later assignments to the same key override earlier ones. The ${?...} syntax (with the ?) means the substitution is optional — if the env var is not set, the override line is silently ignored and the default stands. Without the ?, a missing env var would cause a config resolution error.
This pattern appears throughout Lucille’s example configs for URLs, credentials, file paths, and index names.
Composing Configs from Multiple Files
The lucille-file-to-file-example demonstrates how to split a config into reusable pieces:
# file-to-file-example.conf (main config)

# include connector definitions from separate files and bind to variables
csv_connector = { include "csv-connector.conf" }
json_connector = { include "json-connector.conf" }

# reference the included connectors in the connector list
connectors: [${csv_connector}, ${json_connector}]

# include pipeline definitions from another file
include "simple-pipeline.conf"
# csv-connector.conf (reusable connector definition)
class: "com.kmwllc.lucille.connector.FileConnector"
name: "csv_connector"
paths: ["conf/source.csv"]
pipeline: "simple_pipeline"
fileHandlers: {
  csv: { }
}
# simple-pipeline.conf (reusable pipeline definition)
pipelines: [
  {
    name: "simple_pipeline"
    stages: [
      {
        class: "com.kmwllc.lucille.stage.RenameFields"
        fieldMapping {
          "name" : "my_name"
          "price" : "my_price"
          "country" : "my_country"
        }
      }
    ]
  }
]
This decomposition means:
- The connector definition can be reused in other ingests.
- The pipeline definition can be shared across connectors.
- The main config is a short composition of included pieces.
Containerized Deployment
The lucille-file-to-file-example includes a Dockerfile that demonstrates the standard pattern for running Lucille in a container:
FROM eclipse-temurin:17
COPY target/ /target/
COPY conf/ /conf/
ENV CONF=""
ENTRYPOINT java -Dconfig.file=${CONF} -cp 'target/lib/*' com.kmwllc.lucille.core.Runner
The container is launched with:
docker run --env CONF=conf/my-ingest.conf \
           --env OPENSEARCH_URL=https://prod-cluster:9200 \
           --env OPENSEARCH_INDEX=production \
           -it lucille-example
The config file provides structure and defaults. Environment variables provide deployment-specific overrides. No code changes, no config file modifications, no rebuild required.
Pre-Run Validation
Before any run starts, Lucille validates the entire configuration against every component’s SPEC declaration. This catches:
- Missing required parameters
- Unrecognized parameters (typos)
- Type mismatches
- Invalid combinations
All errors are reported at once — not fail-fast on the first error. This means a developer can fix all config issues in one pass rather than discovering them one at a time through repeated failed starts.
Configuration can also be validated without execution using the -validate flag:
java -Dconfig.file=conf/my-ingest.conf -cp 'target/lib/*' com.kmwllc.lucille.core.Runner -validate
This is useful in CI pipelines that want to catch config errors before deployment without actually running an ingest.
The -render flag prints the fully resolved config (with all substitutions applied) so you can verify what values Lucille will actually see at runtime:
java -Dconfig.file=conf/my-ingest.conf -cp 'target/lib/*' com.kmwllc.lucille.core.Runner -render
How Components Read Configuration
Every Lucille component receives a Config object and reads its parameters using the Typesafe Config API:
// Required parameters — throw if absent
String url = config.getString("opensearch.url");
int batchSize = config.getInt("indexer.batchSize");
List<String> fields = config.getStringList("columns");

// Optional parameters with defaults — use ConfigUtils.getOrDefault
String dest = ConfigUtils.getOrDefault(config, "dest", "output");
int timeout = ConfigUtils.getOrDefault(config, "batchTimeout", 100);
boolean flag = ConfigUtils.getOrDefault(config, "acceptInvalidCert", false);

// Check presence before reading
if (config.hasPath("s3")) {
  Config s3Config = config.getConfig("s3");
  String accessKey = s3Config.getString("accessKeyId");
}

// Nested config blocks
List<? extends Config> stages = config.getConfigList("stages");
The ConfigUtils.getOrDefault utility is Lucille’s standard pattern for optional parameters. It avoids the verbosity of config.hasPath("x") ? config.getString("x") : default that would otherwise appear in every component.
Configuration Structure
A complete Lucille config has the following top-level structure:
connectors: [...]     # list of connector definitions (executed in sequence)
pipelines: [...]      # list of pipeline definitions (referenced by connectors)
indexer { ... }       # indexer type and general settings
solr { ... }          # or opensearch { ... } or elastic { ... } — backend-specific settings
worker { ... }        # worker thread count, timeout, retry settings
kafka { ... }         # Kafka connection info (for distributed mode)
publisher { ... }     # backpressure settings
runner { ... }        # runner-level settings (connector timeout, metrics logging)
log { ... }           # logging interval
zookeeper { ... }     # ZooKeeper connection (for distributed retry tracking)
Each connector references a pipeline by name. Each pipeline defines its stages. The indexer block is shared across all pipelines (a single destination for the run). This structure means you can define multiple connectors feeding different pipelines, all writing to the same search backend, in a single config file.
For a complete, annotated listing of every supported top-level configuration property (excluding per-stage parameters), see application-example.conf in the repository root. It covers all valid keys for indexer, worker, kafka, publisher, runner, log, zookeeper, and the other top-level blocks, with comments explaining each option.
Configuration in Distributed Mode
A configuration file is necessary for running all Lucille components — the full system in local mode as well as dedicated Workers, Indexers, and WorkerIndexers in distributed and streaming modes.
One Config for All Components
In distributed mode, it is a best practice to pass the same full configuration file to all components, even though each component only reads the sections relevant to it. A Worker, for example, does not need to know about indexing settings, and an Indexer does not need to know the pipeline definition. But passing the same file to all components is simpler and less error-prone than maintaining separate configs for each component type.
Users are responsible for ensuring the same config is provided to all components. Lucille does not detect inconsistencies across processes. If a user mistakenly passes two different configs — with different definitions of the same named pipeline — to two Worker instances, the Workers will apply different enrichment logic to documents. The result would be inconsistent enrichment in the search index, and Lucille would not raise an error because each Worker sees only its own config and has no way to compare it with another process.
Why This Is Not a Problem in Practice
In practice, config consistency does not turn out to be a significant operational challenge. When setting up a distributed ingest, you already need a way to copy the same Lucille JARs and libraries to all machines (or containers) where Lucille will run. The configuration files for the project should be copied at the same time, using the same mechanism.
In a containerized deployment this is trivial: include the config file in your Docker image and then use the same image for launching all Lucille components (Runner, Worker, Indexer, WorkerIndexer). The image guarantees that every component sees identical JARs, libraries, and configuration. The only variation between containers is the entrypoint command that determines which component role to start.
Summary
Lucille’s configuration approach is built on three principles:
Delegate complexity to the config library. Environment variable resolution, file composition, type coercion, and precedence rules are handled by Typesafe Config, not by application code. Components simply call typed getters and get resolved values.
Validate early and completely. The SPEC system catches config errors before any work begins. All errors are reported at once. Validation can run without execution for CI integration.
Support real-world deployment patterns. File includes for config reuse across ingests. Environment variable substitution for containerized deployments. The
-Dconfig.filesystem property for selecting configs at runtime. The-renderflag for debugging resolved values.
2 - Deployment
Choose a deployment mode based on your scale requirements. The same pipeline configuration runs in all modes — switching modes requires only a command-line flag change, not a code change.
| Mode | When to Use | Command |
|---|---|---|
| Local Batch | Development, small jobs (< millions of docs) | java -cp ... com.kmwllc.lucille.core.Runner |
| Distributed Batch | Production scale-out with multiple workers | Separate Runner, Worker, and Indexer processes |
| Distributed Streaming | Continuous ingestion without a Runner | Separate Worker and Indexer processes |
| Hybrid Streaming | Streaming with co-located processing and indexing | WorkerIndexer processes |
| Deployment Pattern | Details |
|---|---|
| Docker Compose | Quick distributed setup with all components in containers |
| Kubernetes | Production at scale with CronJobs, Deployments, and HPA |
| Production Operations | Memory sizing, backpressure, graceful shutdown, monitoring |
2.1 - Local Batch
Local Mode
In local mode, you start a single Java process at the command line, invoking the main() method of com.kmwllc.lucille.core.Runner. Alternatively, if you are using Lucille as a dependency in your own Java project, you call Runner.run() from your code.
All components (Connector, Workers, Indexer) run as threads in a single JVM. Communication uses in-memory queues. There is no external infrastructure required — no Kafka, no ZooKeeper, no separate processes.
Best for: Development, scheduled batch jobs, single-machine production runs.
Note: While local mode is the first mode you’d want to use when developing a pipeline or doing a proof-of-concept, it is not at all a “toy” mode. It is fully suitable for production batch workflows assuming you don’t need the additional parallelism and crash resilience features of distributed mode.
Prerequisites
To run Lucille in local mode you need:
- A Lucille configuration file — specifies connectors, pipelines, stages, and indexer settings. See Configuration for details.
- The Lucille JAR and lib directory — the compiled JAR plus its dependency libraries, both placed on the classpath.
Running from the Command Line
A typical invocation looks like:
java \
  -Xmx4g \
  -Dconfig.file=/path/to/application.conf \
  -cp 'lucille-core/target/lucille.jar:lucille-core/target/lib/*' \
  com.kmwllc.lucille.core.Runner
Running Programmatically
If Lucille is a dependency in your own project, you can trigger a run from Java code:
Config config = ConfigFactory.load("application.conf");
Runner.run(config);
Scaling in Local Mode
In local mode, the main way to scale is to increase the number of Worker threads. This allows you to:
- Do more I/O concurrently (if the pipeline is I/O-bound)
- Take advantage of available CPU cores for pipeline processing
Each Worker thread runs an independent copy of the pipeline, and the Worker threads together process documents concurrently.
worker {
  threads: 8
}
2.2 - Distributed Batch
Kafka-Distributed Mode
In distributed mode, each Lucille component runs as its own JVM process. All inter-component communication uses Kafka topics.
Best for: Large-scale batch ingests, multi-machine deployments, horizontal scaling.
Prerequisites
Before starting any Lucille component in distributed mode, ensure:
- Kafka is running and reachable from all machines that will run Lucille components
- Kafka topics are created for each pipeline referenced by your connectors (or auto-creation is enabled on the broker) — see Kafka Topic Setup for details
- Workers and Indexer are running for each pipeline referenced by your connectors — see Starting Each Component
- Search backend collection/index exists (Solr, OpenSearch, Elasticsearch, etc.)
- ZooKeeper is running (only if using
worker.maxRetriesfor poison-pill protection) - Same config file is available to all Lucille processes (Runner, Workers, Indexer)
Start Order
Start components in this order:
- ZooKeeper (if using
worker.maxRetries) - Kafka
- Workers — start consuming before any documents arrive
- Indexer — create the search backend collection/index first, then start the Indexer process
- Runner — triggers the run once Workers and Indexer are ready
The Runner should be started last. It immediately begins publishing documents to Kafka. If Workers or the Indexer aren’t ready, documents will queue on the source topic (which is fine) but the run won’t complete until they start consuming.
Kafka Configuration
All distributed-mode Kafka settings belong in a top-level kafka {} block shared by all components:
kafka {
  bootstrapServers: "kafka1:9092,kafka2:9092"

  # Consumer group ID for all Lucille Workers and Indexers
  consumerGroupId: "lucille_workers"

  # Maximum time between polls before consumer is evicted from consumer group
  maxPollIntervalSecs: 600

  # Maximum request size in bytes — increase for large documents
  maxRequestSize: 250000000

  # TLS/SASL — provide Java properties files for detailed Kafka client config
  securityProtocol: "SSL"
  consumerPropertyFile: "/path/to/consumer.properties"
  producerPropertyFile: "/path/to/producer.properties"
  adminPropertyFile: "/path/to/admin.properties"

  # Custom document serializer/deserializer (override only if needed)
  documentDeserializer: "com.kmwllc.lucille.message.KafkaDocumentDeserializer"
  documentSerializer: "com.kmwllc.lucille.message.KafkaDocumentSerializer"

  # Set to false to disable event tracking (FINISH/FAIL/DROP events won't be published)
  events: true

  # Override source topic name (default: auto-generated from pipeline name)
  sourceTopic: "my-pipeline-source"

  # CAUTION: Setting eventTopic disables per-run topic isolation. Only use this
  # in streaming/connectorless mode where no Runner is coordinating the run.
  # In batch mode with a Runner, omit this — Lucille generates a per-run event topic
  # automatically to prevent cross-run event interference.
  # eventTopic: "lucille_events"
}
Kafka Topic Setup
Lucille uses Kafka topics to pass documents between components. If your Kafka broker has auto.create.topics.enable set to true (the default), you don’t need to create any topics yourself. If auto-create is disabled, you must pre-create certain topics before starting Lucille.
If auto-create is enabled
Lucille will create topics automatically on first use. No manual setup is required. However:
- Auto-created topics use the broker’s
num.partitionsdefault (typically 1). This limits parallelism — see the partition guidance below. - Lucille does not clean up topics after a run. Event topics accumulate over time (one per run). Consider a retention policy or periodic cleanup.
- The event topic is an exception: Lucille always creates it explicitly via the Kafka Admin API with exactly 1 partition, regardless of
auto.create.topics.enable. This requires Admin API permissions on the Kafka cluster.
If auto-create is disabled
Create the following topics before starting Lucille:
| Topic | Default name | Override | Partitions | Created by |
|---|---|---|---|---|
| Source | {pipeline}_source | kafka.sourceTopic | ≥ total Worker threads across all processes | Admin |
| Dest | {pipeline}_dest | — (not overridable) | ≥ number of Indexer processes (typically 1) | Admin |
| Event | {pipeline}_event_{runId} | kafka.eventTopic | Exactly 1 (required for ordering) | Lucille creates this automatically via Admin API |
| Fail | {pipeline}_fail | — (not overridable) | ≥ 1 | Admin (only needed if worker.maxRetries is configured) |
Example — for a pipeline named my-pipeline with 8 Worker threads:
kafka-topics.sh --create --topic my-pipeline_source \
  --partitions 8 --replication-factor 2 \
  --bootstrap-server kafka:9092

kafka-topics.sh --create --topic my-pipeline_dest \
  --partitions 1 --replication-factor 2 \
  --bootstrap-server kafka:9092

# Only if worker.maxRetries is configured:
kafka-topics.sh --create --topic my-pipeline_fail \
  --partitions 1 --replication-factor 2 \
  --bootstrap-server kafka:9092
You do not need to create the event topic — Lucille creates it automatically at the start of each run via the Admin API. This requires that the Kafka user Lucille connects with has CreateTopics permission. If your Kafka cluster requires separate admin credentials, provide them via kafka.adminPropertyFile.
Topic details
Source topic ({pipeline}_source)
The Runner publishes documents here; Workers consume from it. The partition count determines the maximum number of Worker threads that can consume in parallel — excess threads beyond the partition count will sit idle. Set the partition count to at least the total number of Worker threads you plan to run across all Worker processes.
Override the name with kafka.sourceTopic in your config if you need a custom topic name (e.g., when consuming from a topic managed by another system in streaming mode).
Dest topic ({pipeline}_dest)
Workers publish processed documents here; the Indexer consumes from it. A single partition is sufficient for most deployments because the Indexer is rarely the bottleneck — it sends batched bulk requests to the search backend and is I/O-bound on the backend’s write capacity, not on Kafka consumption. Multiple partitions are only needed if you run multiple Indexer processes (uncommon).
The name is not overridable — it is always {pipeline}_dest.
Event topic ({pipeline}_event_{runId})
Workers and Indexers publish lifecycle events here (CREATE, FINISH, FAIL, DROP); the Publisher on the Runner process consumes them to track run completion. This topic must have exactly 1 partition to guarantee FIFO ordering — if events arrive out of order, the Publisher’s accounting logic can be corrupted (e.g., a child’s FINISH arriving before its CREATE).
Lucille creates this topic explicitly via the Kafka Admin API at the start of each batch run. In batch mode, each run gets its own event topic (the run ID is in the topic name), which prevents events from one run interfering with another when multiple runs overlap. You do not pre-create it.
In streaming mode (no Runner), you can either disable events entirely (kafka.events: false) or set a fixed topic name (kafka.eventTopic: "my_fixed_event_topic") and pre-create it with 1 partition.
Fail topic ({pipeline}_fail)
The Worker publishes poison-pill documents here when they exceed worker.maxRetries. This topic is only used when worker.maxRetries is configured (which also requires ZooKeeper). If you don’t use retry tracking, this topic is never written to and doesn’t need to exist.
Documents in the fail topic can be inspected with standard Kafka tooling, corrected if needed, and replayed by pointing a connector at the topic. The topic relies on auto-creation or must be pre-created by an admin — Lucille does not create it via the Admin API.
The name is not overridable — it is always {pipeline}_fail.
Permissions required
The Kafka user Lucille connects with needs:
| Permission | Reason |
|---|---|
CreateTopics | Lucille creates the event topic via Admin API at the start of each batch run |
Produce on source topic | The Runner publishes documents to the source topic |
Produce on dest topic | Workers publish processed documents to the dest topic |
Produce on event topic | Workers and Indexers publish lifecycle events |
Produce on fail topic | Workers publish poison-pill documents (if maxRetries is configured) |
Consume on source topic | Workers consume documents for processing |
Consume on dest topic | Indexer consumes documents for indexing |
Consume on event topic | The Runner’s Publisher consumes lifecycle events |
Starting Each Component
Runner
The Runner publishes documents to Kafka and waits for all work to complete:
java \
  -Dconfig.file=/path/to/config.conf \
  -cp 'lucille-core/target/lucille.jar:lucille-core/target/lib/*' \
  com.kmwllc.lucille.core.Runner \
  -usekafka
Workers
Start one or more Worker processes, each consuming from the Kafka source topic:
java \
  -Dconfig.file=/path/to/config.conf \
  -cp 'lucille-core/target/lucille.jar:lucille-core/target/lib/*' \
  com.kmwllc.lucille.core.Worker \
  my-pipeline-name
Adding more Worker processes increases throughput proportionally. Workers join the same Kafka consumer group — Kafka distributes partitions automatically.
Indexer
java \
  -Dconfig.file=/path/to/config.conf \
  -cp 'lucille-core/target/lucille.jar:lucille-core/target/lib/*' \
  com.kmwllc.lucille.core.Indexer \
  my-pipeline-name
If the search backend collection does not yet exist, create it before launching the Indexer:
# Create Solr collection, then start Indexer
curl 'http://solr:8983/solr/admin/collections?action=CREATE&name=my-collection&numShards=1&collection.configName=_default'
java -Dconfig.file=/conf/config.conf -cp '/target/lib/*' com.kmwllc.lucille.core.Indexer my-pipeline
Long-Running Workers and Indexers
Worker and Indexer processes are long-running services — they are not started or stopped by the Runner. A Runner invocation triggers a single batch run and exits when it completes, but the Workers and Indexers that processed its documents keep running and are ready to handle the next run immediately.
Sequential runs share the same processes. You can invoke the Runner repeatedly — nightly, hourly, or on demand — against the same pool of Workers and Indexers without restarting them. Each invocation is an independent run with its own accounting; the processes simply continue consuming from the source topic.
Concurrent runs are supported. Multiple Runner invocations can be active simultaneously, all handled by the same Workers and Indexers. Documents from different runs are interleaved on the Kafka source topic and processed without coordination or interaction between runs.
Multiple pipelines can coexist. A single Lucille config can define multiple connectors feeding different pipelines. In distributed mode, each pipeline has its own set of Kafka topics ({pipeline}_source, {pipeline}_dest). You can run separate fleets of Workers and Indexers for each pipeline — start Workers with com.kmwllc.lucille.core.Worker pipeline-a and separately com.kmwllc.lucille.core.Worker pipeline-b. The Runner publishes each connector’s documents to the correct pipeline’s source topic based on the connector’s pipeline config property.
The constraint is: for each pipeline referenced by a connector in your config, Workers and an Indexer must be running for that pipeline before the Runner starts. If a connector references pipeline: "enrichment", there must be Workers consuming from enrichment_source and an Indexer consuming from enrichment_dest.
Multi-connector runs execute connectors sequentially within a single Runner invocation. Each connector’s documents are published to its pipeline’s source topic, and the Runner waits for all of that connector’s documents to reach a terminal state before starting the next connector. If a connector fails, subsequent connectors are skipped.
How run isolation works. The Publisher stamps a unique run_id on every document it publishes. When a Worker or Indexer sends a lifecycle event (FINISH, FAIL, DROP) for a document, it reads the run_id from that document to determine which Kafka event topic to write to. Each run has its own dedicated event topic named {pipeline}_event_{runId}. The Publisher for each Runner invocation only consumes its own event topic, so completion accounting is completely isolated — concurrent runs do not interfere with each other.
2.3 - Distributed Streaming
Streaming Mode (Connectorless)
In streaming mode, Lucille runs without a Runner or Connector. An external system places documents onto a Kafka source topic directly, and one or more Worker or WorkerIndexer processes consume and process them continuously — with no run boundary or completion accounting.
When to use: Keeping a search index in sync with a live system (e.g., consuming from a CDC topic, Debezium, or any Kafka producer). The pipeline logic is identical to batch mode; only the execution model changes.
Starting Workers in Streaming Mode
java \
  -Dconfig.file=/path/to/config.conf \
  -cp 'lucille-core/target/lucille.jar:lucille-core/target/lib/*' \
  com.kmwllc.lucille.core.Worker \
  my-pipeline-name
Or use WorkerIndexer to co-locate processing and indexing in one process:
java \
  -Dconfig.file=/path/to/config.conf \
  -cp 'lucille-core/target/lucille.jar:lucille-core/target/lib/*' \
  com.kmwllc.lucille.core.WorkerIndexer \
  my-pipeline-name
External documents must be placed onto the topic named {pipeline-name}_source (or the topic named by kafka.sourceTopic if set).
Consuming from Multiple Topics with a Pattern
When running a WorkerIndexer in streaming mode, kafka.sourceTopic is interpreted as a Java regex pattern rather than a literal topic name. This means a single WorkerIndexer process can consume from multiple Kafka topics simultaneously by setting sourceTopic to a pattern that matches all of them:
kafka {
  bootstrapServers: "kafka:9092"
  sourceTopic: "orders_.*_source"   # matches orders_us_source, orders_eu_source, etc.
  events: false
}
Kafka’s consumer group protocol assigns partitions from all matching topics to the consumer. As new matching topics are created, the consumer group rebalances and picks them up automatically.
Note: this behavior applies to WorkerIndexer only. A standalone Worker subscribes to a single exact topic name and does not support pattern matching.
Configuration for Streaming Mode
Streaming mode uses the same pipeline and Kafka configuration as distributed batch mode, with two differences:
- No
connectorsblock — external producers push documents to the Kafka source topic. - No Publisher — there is no run boundary and no completion accounting.
Run IDs in Streaming Mode
In batch mode, the Publisher stamps a run_id on every document at publication time. In streaming mode there is no Publisher, so documents arriving from an external system typically have no run_id field. This is normal and expected — the run_id is a batch-mode concept.
Consequences of absent run_ids:
- The Worker’s MDC will have no
run_idcontext in log lines (the field is null). - If events are enabled, the default event topic name would be
{pipeline}_event_null(since the topic name is derived from the run_id).
If your external system wants to stamp a run_id on documents (e.g., to correlate a batch of updates), it can include a run_id field in the JSON before placing it on the Kafka topic. The Worker will read it and use it for MDC logging. But this is entirely optional.
Event Configuration for Streaming Mode
| Scenario | Setting | Why |
|---|---|---|
| No event tracking needed | kafka.events: false | Most common for streaming. No Publisher is listening, so events would go unread. |
| Events needed for external monitoring | kafka.eventTopic: "lucille_events" | Sends all events to a fixed topic name. An external system can consume this topic to track document success/failure. |
| Events needed with per-document run_ids | kafka.events: true (default) | Only works if the external producer stamps run_id on documents. Events route to {pipeline}_event_{runId}. |
Recommendation: Set kafka.events: false unless you have a specific consumer for the event topic. If you do need events, set kafka.eventTopic to a fixed name to avoid the _event_null topic naming issue.
kafka {
  bootstrapServers: "kafka:9092"

  # Option A: Disable events entirely (most common for streaming)
  events: false

  # Option B: Send events to a fixed topic for external monitoring
  # events: true
  # eventTopic: "lucille_events"
}

pipelines: [
  {
    name: "my-pipeline"
    stages: [ ... ]
  }
]

indexer { type: "OpenSearch" }
opensearch { ... }
Batch vs. Streaming: Same Pipeline Logic
The same Stage implementations work in both modes. Develop and test enrichment logic in batch mode (where RunType.TEST and the run summary make correctness verification straightforward), then deploy the same pipeline configuration in streaming mode for real-time production ingestion. For real-world search systems — which typically need an initial batch backfill followed by continuous updates — this means one pipeline definition, not two.
2.4 - Hybrid Streaming
Hybrid Streaming Mode
In hybrid streaming mode, Lucille runs one or more WorkerIndexer processes that co-locate document processing and indexing in a single JVM. Like distributed streaming, there is no Runner or Connector — an external system places documents onto a Kafka source topic, and the WorkerIndexer processes consume, enrich, and index them continuously.
When to use: Streaming ingestion where you want the horizontal scalability of distributed mode but with simpler operations — fewer processes to manage, no separate Indexer deployment, and reduced network hops between processing and indexing.
This page is under construction. See Distributed for WorkerIndexer usage details in the meantime.
2.5 - Docker Compose
Docker Compose Deployment
Docker Compose is the simplest way to run Lucille in distributed mode. The lucille-distributed-example provides a complete working template. The key structure:
services:
  zookeeper:
    # Bundled with Kafka; required for Kafka's internal coordination
    image: ...

  kafka:
    depends_on: [zookeeper]
    healthcheck:
      test: ["CMD", "kafka-topics.sh", "--bootstrap-server=kafka:9092", "--list"]

  worker:
    depends_on:
      kafka: { condition: service_healthy }
    entrypoint: java -Dconfig.file=/conf/config.conf -cp '/target/lib/*'
                     com.kmwllc.lucille.core.Worker my-pipeline

  indexer:
    depends_on:
      kafka: { condition: service_healthy }
      solr:  { condition: service_healthy }
    healthcheck:
      # Delegate healthcheck to the search backend — Runner waits for this before starting
      test: curl -f 'http://solr:8983/solr/...'
    entrypoint: |
      # Create the collection, then start the Indexer
      curl 'http://solr:8983/solr/admin/collections?action=CREATE&name=quickstart...'
      java -Dconfig.file=/conf/config.conf -cp '/target/lib/*'
           com.kmwllc.lucille.core.Indexer my-pipeline

  runner:
    depends_on:
      kafka:   { condition: service_healthy }
      indexer: { condition: service_healthy }  # Ensures Indexer + backend are ready
    entrypoint: java -Dconfig.file=/conf/config.conf -cp '/target/lib/*'
                     com.kmwllc.lucille.core.Runner -usekafka
Key design points from the example:
- All components share one config file —
config.filepoints to the same.conffor all containers. - Classpath is
target/lib/*— Maven’sdependency:copy-dependenciesputs all JARs there; the main lucille JAR and all dependencies are sibling files. - The Indexer container’s health check proxies the search backend’s health — this causes Docker Compose to hold the Runner until the search backend is ready, without the Runner needing to know anything about it.
- Workers start before the Runner — Kafka consumer group rebalancing takes time; workers should be consuming before the Runner begins publishing documents.
2.6 - Kubernetes
Kubernetes Deployment
Lucille’s architecture maps naturally onto Kubernetes primitives.
Batch Jobs as Kubernetes CronJobs
For scheduled batch ingests, package Lucille as a container and run it as a CronJob. When the run completes, the container exits — there is no long-running process to manage between runs.
Minimal Dockerfile:
FROM eclipse-temurin:17-jre

WORKDIR /app

# Copy all JARs (lucille-core + dependencies) from the Maven build output
COPY target/lib/ lib/

# Copy your pipeline configuration
COPY conf/ conf/

# The config file path is provided via an environment variable at runtime
ENV CONF=""
ENTRYPOINT ["sh", "-c", "java -Xmx4g -Dconfig.file=${CONF} -cp 'lib/*' com.kmwllc.lucille.core.Runner"]
Build the image after running mvn clean install in your project (which copies all dependencies to target/lib/):
docker build -t my-lucille-image .
Run it:
docker run --env CONF=conf/my-pipeline.conf \
           --env OPENSEARCH_URL=https://opensearch:9200 \
           my-lucille-image
The same image can run any Lucille component by overriding the entrypoint:
# Run as a Worker (distributed mode)
docker run --env CONF=conf/my-pipeline.conf \
           --entrypoint sh my-lucille-image \
           -c "java -Xmx2g -Dconfig.file=\${CONF} -cp 'lib/*' com.kmwllc.lucille.core.Worker my-pipeline"

# Run as an Indexer (distributed mode)
docker run --env CONF=conf/my-pipeline.conf \
           --entrypoint sh my-lucille-image \
           -c "java -Xmx1g -Dconfig.file=\${CONF} -cp 'lib/*' com.kmwllc.lucille.core.Indexer my-pipeline"
CronJob:
apiVersion: batch/v1
kind: CronJob
metadata:
  name: lucille-nightly-ingest
spec:
  schedule: "0 2 * * *"  # 2am daily
  jobTemplate:
    spec:
      template:
        spec:
          restartPolicy: OnFailure
          containers:
          - name: lucille
            image: my-registry/lucille:latest
            env:
            - name: OPENSEARCH_URL
              valueFrom:
                secretKeyRef:
                  name: opensearch-credentials
                  key: url
            resources:
              requests:
                memory: "2Gi"
                cpu: "1"
              limits:
                memory: "4Gi"
                cpu: "4"
Distributed Deployment as Kubernetes Pods
In distributed mode, each Lucille component runs as its own pod:
Worker Deployment:
apiVersion: apps/v1
kind: Deployment
metadata:
  name: lucille-workers
spec:
  replicas: 4  # Scale by changing replicas
  selector:
    matchLabels:
      app: lucille-worker
  template:
    metadata:
      labels:
        app: lucille-worker
    spec:
      containers:
      - name: worker
        image: my-registry/lucille:latest
        command: ["java", "-cp", "/app/lucille.jar:/app/lib/*",
                  "com.kmwllc.lucille.core.Worker", "my-pipeline"]
        env:
        - name: config.file
          value: /app/config.conf
        resources:
          requests:
            memory: "2Gi"
            cpu: "2"
Workers are the natural scaling target. When the Kafka source topic backlog grows, increase replicas. Kubernetes’ Horizontal Pod Autoscaler can drive this automatically using Kafka consumer group lag as a metric (via KEDA or similar).
2.7 - Production Operations
Memory Sizing
Rule of thumb: worker.threads × (Stage resource usage). A pipeline that loads a 500MB NLP model uses 500MB × number of Worker threads.
| Component | Typical Heap Size |
|---|---|
| Runner (local, lightweight pipeline) | 512MB–2GB |
| Runner (local, ML stages) | 4GB–16GB per stage model × threads |
| Worker (distributed, no ML) | 512MB–1GB |
| Worker (distributed, with ML models) | 2GB–8GB per model |
| Indexer | 512MB–1GB |
Always set -Xmx explicitly. Avoid letting Java use all available RAM.
Backpressure and Queue Sizing
In local mode, set publisher.queueCapacity to bound the number of in-flight documents:
publisher {
  queueCapacity: 10000
}
In distributed mode, use publisher.maxPendingDocs to throttle the Connector:
publisher {
  maxPendingDocs: 80000
}
Without backpressure, a fast Connector can publish faster than Workers process, causing out-of-memory conditions.
Indexer Batch Tuning
The Indexer sends documents in batches. Both batch size and timeout are independently configurable:
indexer {
  batchSize: 200        # Flush when this many docs accumulate
  batchTimeout: 5000    # Flush after 5 seconds if batchSize is not reached
}
Larger batches improve indexing throughput (fewer API calls). The timeout prevents documents from waiting indefinitely when volume is low.
Graceful Shutdown
Lucille handles SIGINT (Ctrl+C) and SIGTERM gracefully. On receiving a signal:
- The Connector stops publishing new documents.
- Workers drain the remaining documents.
- The Indexer flushes its current batch.
- The process exits with a run summary.
Do not send SIGKILL — documents in flight may not be indexed.
Monitoring
See Logging for setting up log monitoring.
Key metrics logged periodically during a run:
INFO PublisherImpl: 37029 docs published. One minute rate: 3225.69 docs/sec. Waiting on 21014 docs.
INFO WorkerPool: 27017 docs processed. One minute rate: 1787.10 docs/sec. Mean pipeline latency: 10.63 ms/doc.
INFO Indexer: 17016 docs indexed. One minute rate: 455.07 docs/sec. Mean backend latency: 6.90 ms/doc.
The frequency is controlled by log.seconds (default: 30).
Run Summary
At the end of every run, Lucille prints a structured summary:
RUN SUMMARY: Success. 1/1 connectors complete. All published docs succeeded.
connector1: complete. 200000 docs succeeded. 0 docs failed. 0 docs dropped. Time: 416.47 secs.
Run took 417.46 secs.
A connector that failed entirely is distinguished from one that completed with individual document failures. Subsequent connectors after a failure are listed as skipped.
Production Checklist
- Set
-Xmxheap limit appropriate for your pipeline’s memory usage. - Configure
publisher.queueCapacity(local mode) orpublisher.maxPendingDocs(distributed). - Tune
indexer.batchSizeandindexer.batchTimeoutfor your backend’s throughput. - Use environment variable substitution for credentials (
${?VAR_NAME}) — never hard-code secrets in config files. - Route
DocLoggeroutput to a separate file in production (see Logging). - Enable
runner.metricsLoggingLevel: "INFO"for stage-by-stage metrics at run completion. - Configure
worker.maxRetriesand ZooKeeper if poison-pill protection is needed — without this, a document that repeatedly crashes a Worker will stall the pipeline indefinitely. Failed documents are routed to the{pipeline}_failtopic for inspection and replay. - Set
runner.connectorTimeoutif any connector might run longer than 24 hours (the default timeout).
3 - Logging Setup
Lucille Logs
Lucille uses Log4j2 (via SLF4J) for all logging. A default log4j2.xml is included in lucille-core/src/main/resources/.
Using a Custom Log4j2 Configuration
To override the default logging configuration, pass the standard Log4j2 system property on the Java command line:
java -Dlog4j.configurationFile=/path/to/my-log4j2.xml \
     -Dconfig.file=my-pipeline.conf \
     -cp 'target/lib/*' \
     com.kmwllc.lucille.core.Runner
This applies to all Lucille components (Runner, Worker, Indexer, WorkerIndexer). If you don’t provide this property, Log4j2 uses whatever log4j2.xml it finds on the classpath.
Common reasons to provide a custom configuration:
- Route the DocLogger to a separate file (to avoid mixing per-document lifecycle events with operational logs)
- Enable JSON-formatted output for log aggregation tools
- Adjust log levels for specific packages (e.g., suppress noisy third-party library logging)
- Configure log rotation policies for long-running Worker/Indexer processes
There are many ways you can use the logs output by Lucille. Lucille has, essentially, two main loggers for tracking your Lucille run:
the Root logger, and the DocLogger.
The Root Logger
The Root logger outputs log statements from a variety of sources, allowing you to track your Lucille run. For example, the Root logger
is where you’ll get intermittent updates about your pipeline’s performance, warnings from Stages or Indexers in certain situations, etc.
The Doc Logger
The DocLogger is very verbose - it tracks the lifecycle of each Document in your Lucille pipeline.
For example, a log statement is made when a Document is created, before it is published, before & after a Stage operates on it… etc.
As you can imagine, this results in many log statements - it is recommended these logs are stored in a file, rather than just
having them printed to the console.
Logs from the DocLogger are at ERROR level by default. This means that without log4j2 configuration changes, only error-level document lifecycle events will appear. To capture the full document lifecycle, configure the DocLogger at INFO or DEBUG level in your log4j2.xml and route it to a file — the volume at full verbosity is high.
All document failure messages use a standardized "Document FAILED" prefix, making it straightforward to find every failed document with a single grep. Specific failure types append additional context: "Document FAILED during pipeline processing", "Document FAILED during indexing", or "Document FAILED: retry count exceeded".
MDC Fields
Lucille populates the SLF4J Mapped Diagnostic Context (MDC) so that every log line includes structured context you can filter on:
| MDC Key | Value | Description |
|---|---|---|
run_id | UUID string | The unique ID for the current run. Set at run start; present on all log lines during the run. |
id | Document ID string | The ID of the document currently being processed. Set per-document inside Workers. |
When storing logs as JSON (ECS layout), these appear as top-level fields in each log record, making it easy to filter all activity for a specific document or run.
Log Files
Lucille can store logs in a file as plain text or as JSON objects. When storing logs as JSON, each line will be a JSON object representing
a log statement in accordance with the EcsLayout. By modifying the log4j2.xml, you can control which Loggers are enabled/disabled,
where their logs get stored, and what level of logs you want to process.
Logstash & OpenSearch
If you store your logs as JSON, you can easily run Logstash on the file(s), allowing you to index them into a Search Engine of your
choice for enhanced discovery and analysis. This can be particularly informative when working with the DocLogger. For example,
you might:
- Trace a specific Document’s lifecycle by querying by the Document’s ID.
- Using the Timestamp of the logs, track the performance of your Lucille pipeline and identify potential bottlenecks.
- Create Dashboards, allowing you to monitor your pipeline for potential warnings / errors for a repeated Lucille run.
Here is an example pipeline.conf for ingesting your Lucille logs into a local OpenSearch instance:
input {
  file {
    path => "/lucille/lucille-examples/lucille-simple-csv-solr-example/log/com.kmwllc.lucille-json*"
    mode => "read"
    codec => "json"
    start_position => "beginning"
    sincedb_path => "/dev/null"
    exit_after_read => "true"
  }
}
output {
  stdout {
    codec => rubydebug
  }
  opensearch {
    hosts => "http://localhost:9200"
    index => "logs"
    ssl_certificate_verification => false
    ssl => false
  }
}
Note that this pipeline will delete the log files after they are ingested. And, SSL is disabled.
Here are some queries you might run (using curl):
curl -XGET "http://localhost:9200/logs/_search" -H 'Content-Type: application/json' -d '{
  "query": {
    "term": {
      "id.keyword": "songs.csv-1"
    }
  }
}'
This query will only return log statements where the id of the Document being processed is “songs.csv-1”, a Document ID from the Lucille Simple CSV example. This allows you to easily track the lifecycle of the Document as it was processed and published.
curl -XGET "http://localhost:9200/logs/_search" -H 'Content-Type: application/json' -d '{
  "query": {
    "match": {
      "message": "FileHandler"
    }
  }
}'
This query will return log statements with “FileHandler” in the message. This allows you to track specifically when Documents were created from a JSON, CSV, or XML FileHandler.
OpenSearch Dashboards
By filling an OpenSearch Index with your JSON log statements, you can also build OpenSearch Dashboards to monitor your Lucille runs and analyze their performance.
Setting up the Index Pattern
Once you have OpenSearch Dashboards open, click on the menu in the top left. Select Dashboards Management, and then, on this new page, select Index Patterns. Create an Index Pattern for your logs index. As you click through, be sure to choose @Timestamp in the dropdown for “Time Field”.
(Timestamps are very important in OpenSearch Dashboards. Many features will use the timestamp of a Document in some form.)
Discovery
OpenSearch Dashboards has two major “features” - Dashboards and Discover. We’ll start with Discover.
At the top right of the screen, you’ll see a time range. Only logs within this time range will be shown. It defaults to only include logs within the last 15 minutes, so you’ll likely need to change it. Set absolute time ranges that cover your Lucille run. (The UI for setting these times can be a bit finicky, but keep trying.)
Like before, we can trace the entire lifecycle of a single Document. In the search bar, type in: id:"songs.csv-1". Now, you
should only see the log statements relevant to this Document. Each entry will be a large blob of text representing the entire Document.
You can select certain fields on the left side of your screen to get a more focused view of each statement.
You can also sort the statements in a certain order. If you hover over Time at the top of the table, you can click the arrow to sort the logs by their timestamps.
Dashboards
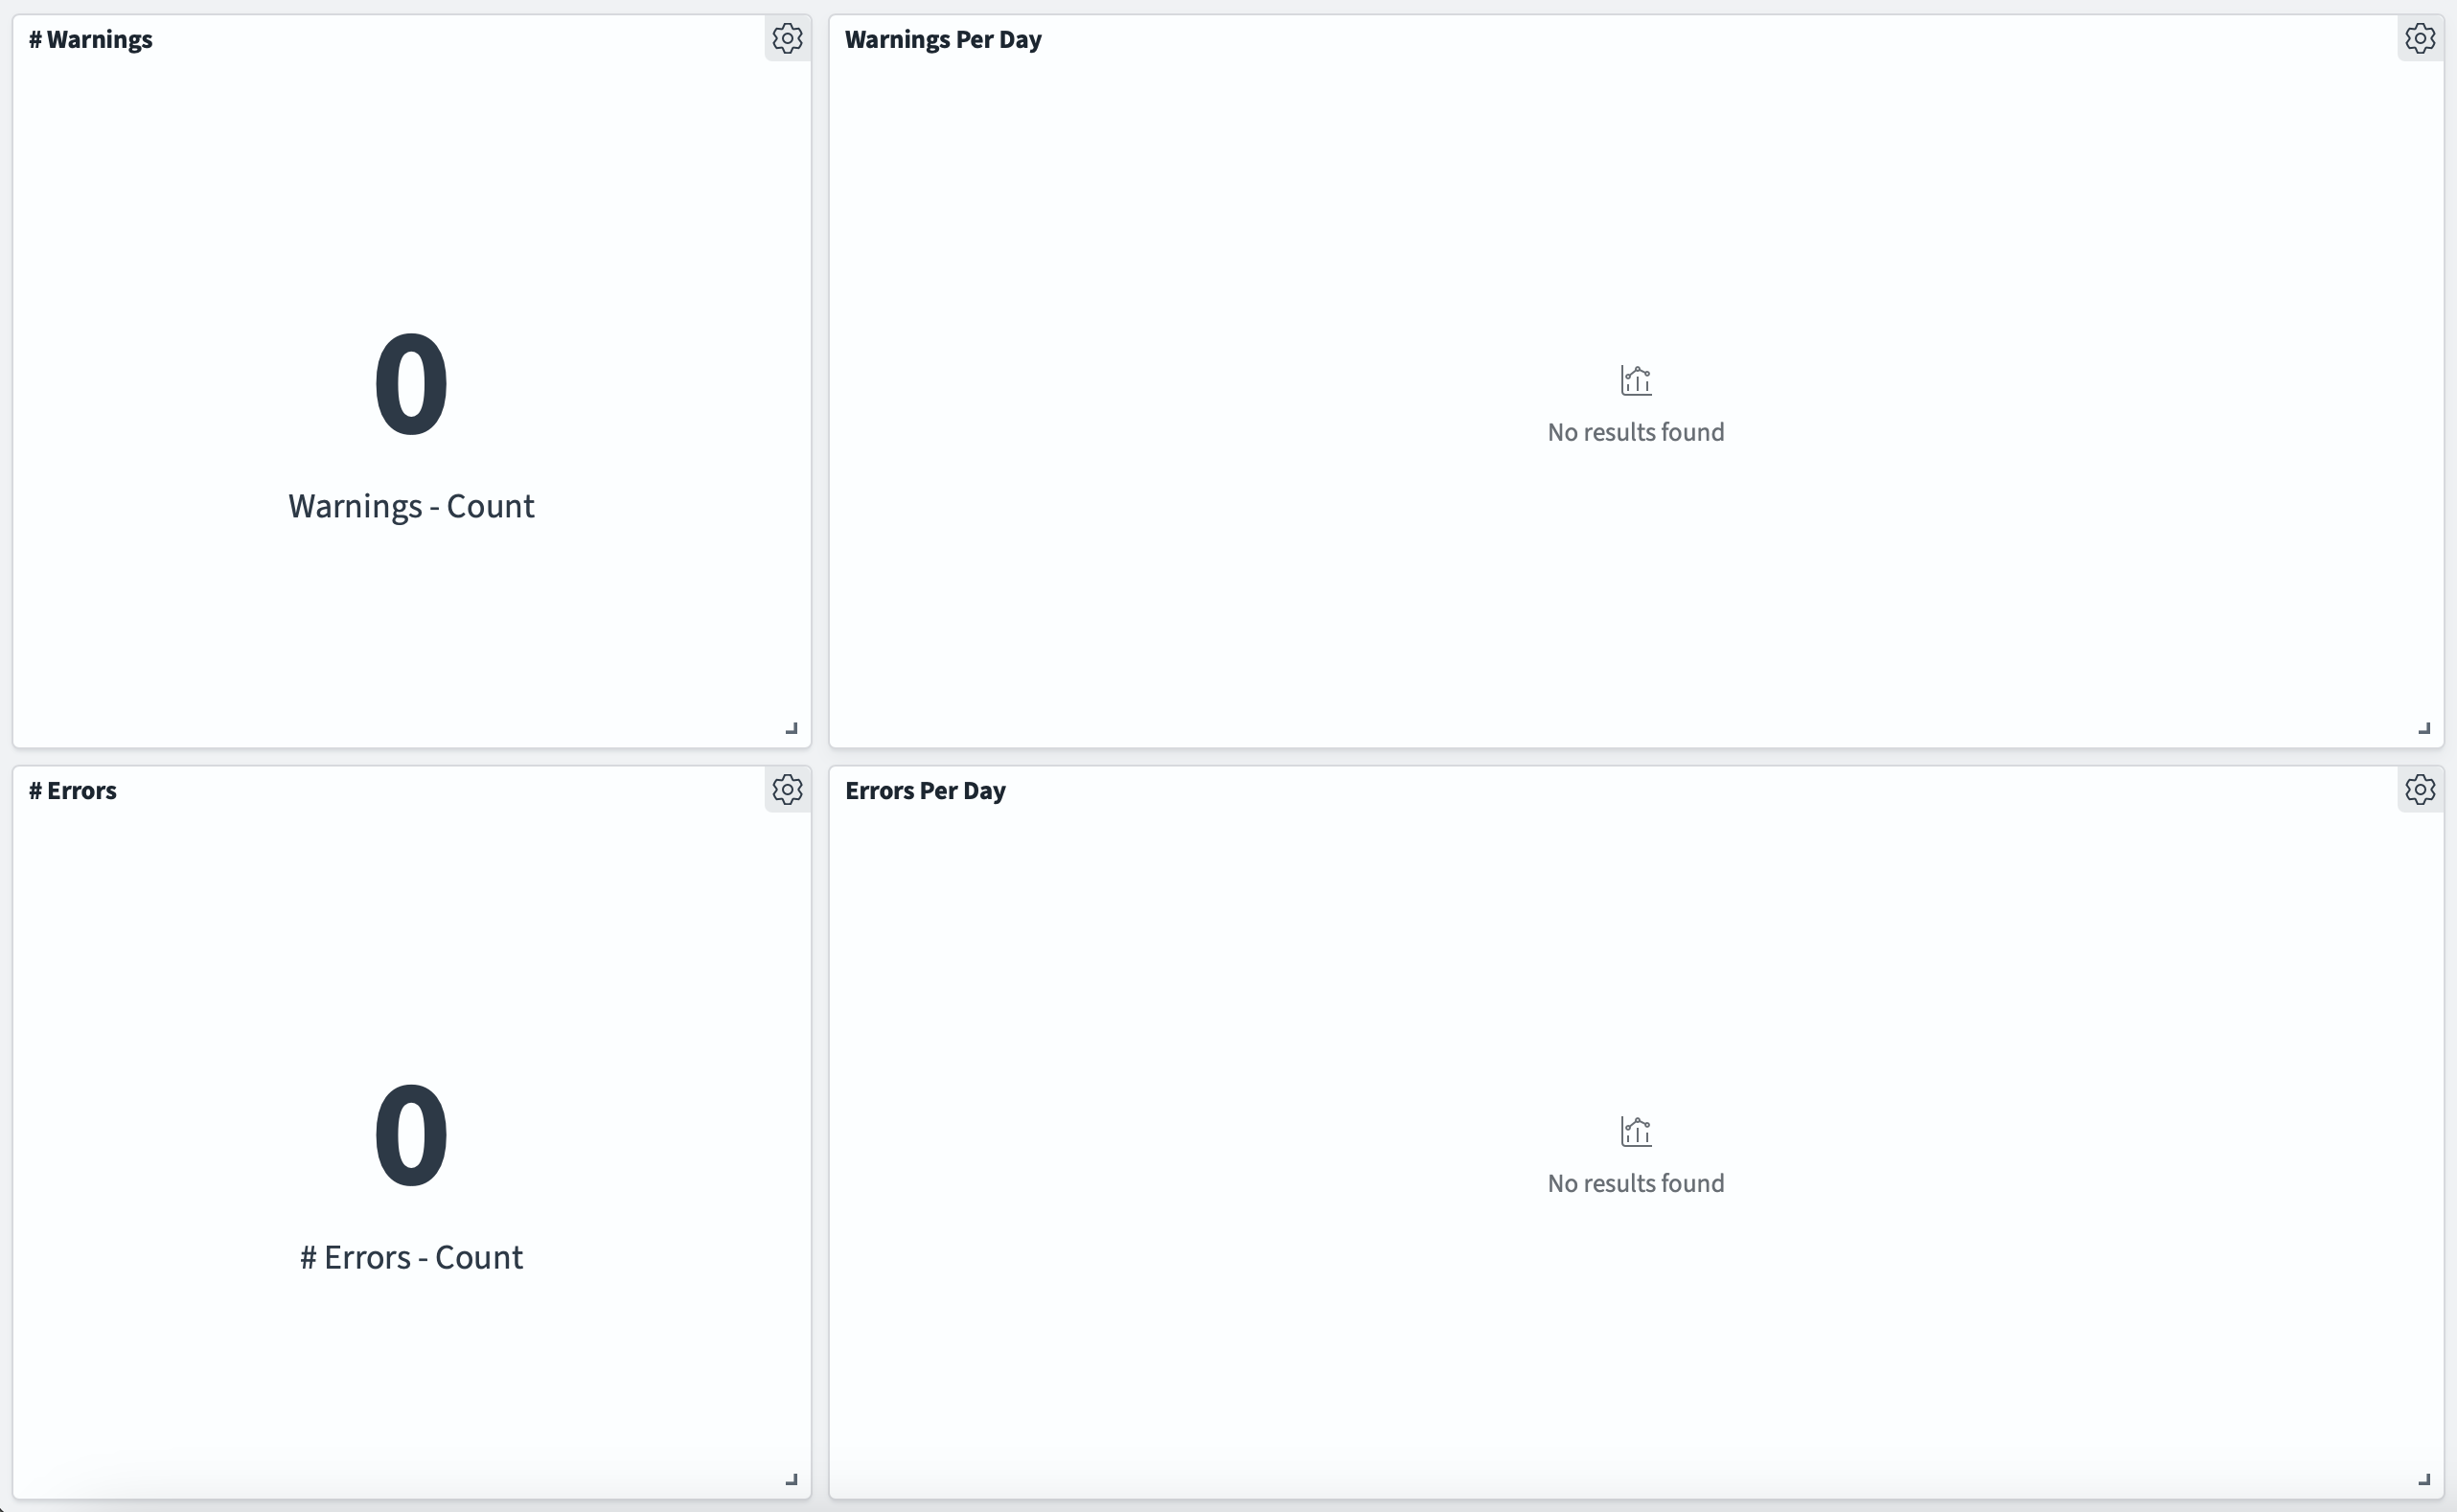
Now, let’s see how Dashboards could help you monitor a certain Lucille run. Imagine you have scheduled a Lucille run to execute every day. We can create a Dashboard that will help us quickly see how many warnings/errors took place.
Click add in the top right to create a new panel. Click + Create new, then choose visualization, and then metric. Choose your logs index as the source.
In this new window, for metric, click buckets. Choose a Filters aggregation, and in the filter, include log.level:"WARN" (using
Dashboards Query Language). This will display the number of log statements with a level of “WARN”.
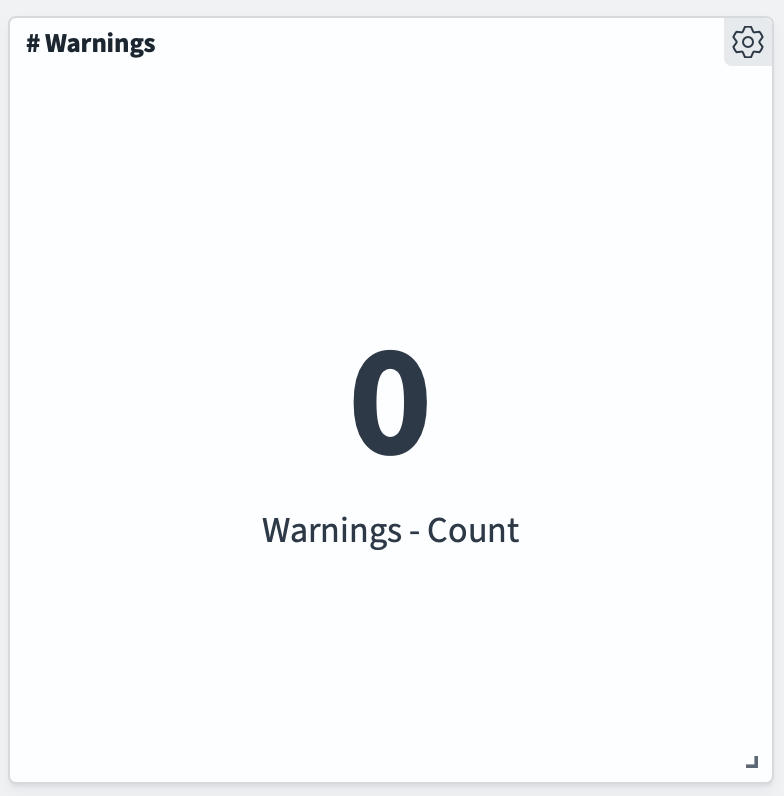
You can then repeat this process, but for logs with a level of ERROR.
Now, let’s make a chart that’ll display the number of warnings per day. Create a new visualization - this time, a vertical bar.
Go to buckets, and add X-axis. Configure it like this:
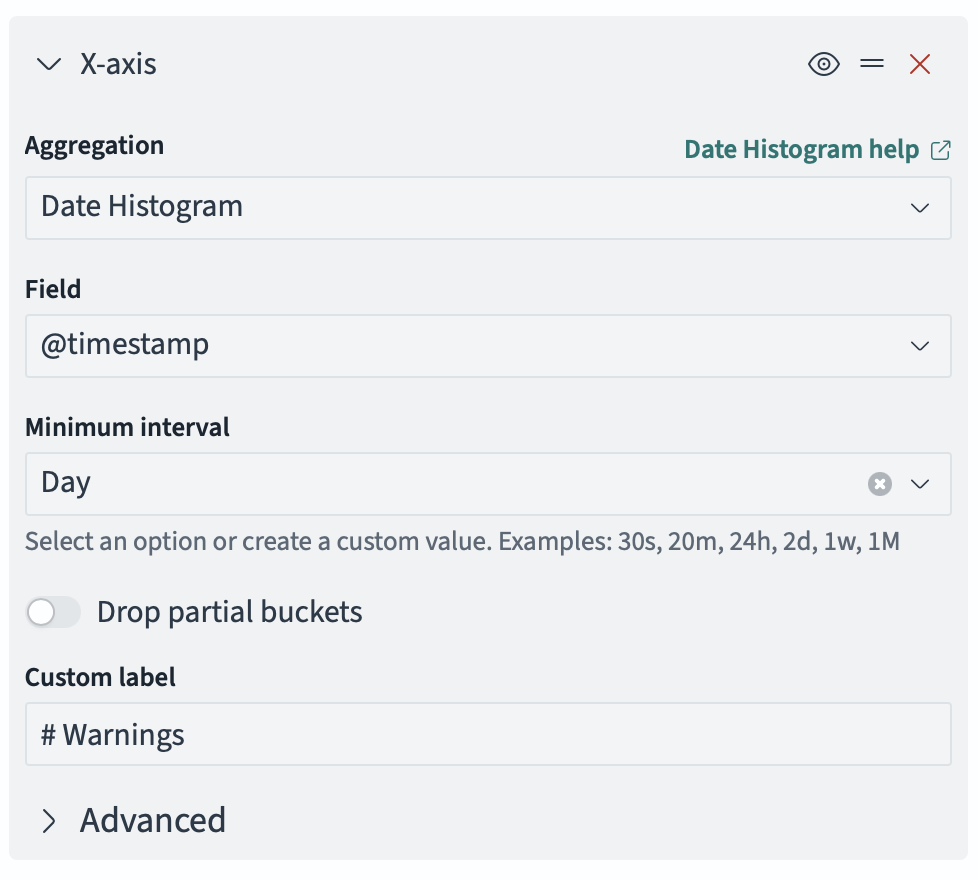
Then, add another bucket - a split series. Configure it just like the panel - a Filters aggregation, with log.level:"WARN".
Now you’ll have a chart tracking the number of warnings per day. And, again, you can do the same for ERROR-level logs.
Your dashboard might look a little something like this (but populated with a little bit of actual data):
4 - Log Interpretation
Log Format
Lucille uses SLF4J with Log4j2 as the logging backend. The log format depends on your Log4j2 configuration:
Plain text (typical console/file output):
2026-05-06 20:51:53.581 INFO [main] c.k.l.c.Runner - Pipeline Configuration is valid.
JSON (structured logging for log aggregation):
{"@timestamp":"2026-05-06T20:51:53.581Z","log.level":"INFO","message":"Pipeline Configuration is valid.","process.thread.name":"main","log.logger":"com.kmwllc.lucille.core.Runner","run_id":"c1d9413a-..."}
The JSON format includes the run_id and id (document ID) fields from the MDC, making it possible to filter logs by run or by document in log aggregation tools. In plain text mode, only the message field is typically visible.
Anatomy of a Log Line
Every log line contains:
- Timestamp — when the event occurred
- Level — INFO, WARN, ERROR, DEBUG
- Thread name — identifies which component generated the message
- Logger — the Java class that emitted the message
- Message — the human-readable content
- MDC fields (in JSON mode) —
run_idand optionallyid(document ID)
Identifying Components by Thread Name
The thread name tells you which component generated the message:
| Thread Name Pattern | Component |
|---|---|
main | Runner (validation, connector orchestration, Publisher waitForCompletion) |
Lucille-{runId}-Connector | ConnectorThread (executing the connector) |
Lucille-{runId}-Worker-1, Worker-2, etc. | Worker threads (pipeline processing) |
Lucille-{runId}-Indexer | Indexer thread |
Lucille-{runId}-WorkerWatcherExecutorService | WorkerPool watcher (periodic stats, stuck-worker detection) |
Lucille-Worker-1 (no runId) | Worker in distributed mode (standalone process, no local run) |
Lucille-Indexer (no runId) | Indexer in distributed mode (standalone process) |
Why the run ID is in the thread name
In a typical batch ingest in single-JVM mode, all threads are dedicated to the same run, so the run ID in the thread name might seem redundant. It exists for a specific scenario: concurrent runs in the same JVM via the REST API.
The lucille-api plugin provides a REST API (built on Dropwizard) that allows runs to be triggered via HTTP. The RunnerManager singleton manages these runs and launches each one asynchronously via CompletableFuture.runAsync(). Multiple runs can execute concurrently in the same JVM — each with its own Connector, WorkerPool, Indexer, and Publisher. Without the run ID in thread names, it would be impossible to tell which log messages belong to which run when two runs are in progress simultaneously.
The thread name is constructed by ThreadNameUtils.createName(name, runId):
- With a run ID:
Lucille-c1d9413a-8191-4f4a-92bb-0fc42b5499e3-Worker-1 - Without a run ID:
Lucille-Worker-1
Run ID handling in distributed mode
In distributed mode, Workers and Indexers are standalone processes that stay alive indefinitely, processing documents from multiple runs over their lifetime. They are NOT started by the Runner and do NOT have a localRunId. This creates a distinction between two kinds of run ID:
Thread-level run ID (in the thread name and MDC): When a Worker or Indexer starts as a standalone process, it has no run ID — the thread name is Lucille-Worker-1 (no UUID) and the MDC run_id is initially null (Worker) or “UNKNOWN” (Indexer).
Document-level run ID (stamped on each document): Each document carries a run_id field stamped by the Publisher when it was published. Documents from different runs may be interleaved on the same Kafka topic.
The Worker handles this by updating the MDC dynamically as it processes each document:
// In Worker.run():
MDC.put(RUNID_FIELD, localRunId);  // null in distributed mode

while (running) {
    doc = messenger.pollDocToProcess();
    // If we don't have a localRunId, use the document's run_id for logging
    if (localRunId == null && doc != null) {
        MDC.put(RUNID_FIELD, doc.getRunId());
    }
    // ... process document ...
}
This means in distributed mode, the run_id in log messages changes with each document — it reflects which run produced that document, not a fixed property of the Worker process.
The Indexer uses a stack-based MDC (pushByKey/popByKey) because it processes batches that may contain documents from different runs:
// In Indexer, when sending events per document:
if (d.getRunId() != null) {
    MDC.pushByKey(RUNID_FIELD, d.getRunId());  // temporarily set for this doc's log lines
}
messenger.sendEvent(d, "SUCCEEDED", Event.Type.FINISH);
if (d.getRunId() != null) {
    MDC.popByKey(RUNID_FIELD);  // restore previous value
}
Practical implication for log analysis: In distributed mode, you cannot rely on the thread name to identify which run a log message belongs to. Instead, filter by the run_id MDC field (available in JSON-formatted logs). In single-JVM mode, the thread name contains the run ID and is sufficient.
Identifying Components by Logger
The log.logger field identifies the class:
| Logger | Component |
|---|---|
com.kmwllc.lucille.core.Runner | Runner orchestration |
com.kmwllc.lucille.core.PublisherImpl | Publisher accounting |
com.kmwllc.lucille.core.WorkerPool | Worker pool management and periodic stats |
com.kmwllc.lucille.core.Indexer | Indexer batching and backend communication |
com.kmwllc.lucille.core.Stage | Per-stage metrics (logged at end of run) |
com.kmwllc.lucille.core.DocLogger | Per-document lifecycle events (if enabled) |
com.kmwllc.lucille.connector.* | Connector-specific messages |
com.kmwllc.lucille.stage.* | Stage-specific messages (warnings, errors) |
Reading a Run from Start to Finish
Phase 1: Validation
The first messages in any run confirm configuration validity:
Pipeline Configuration is valid.
Connector Configuration is valid.
Indexer Configuration is valid.
Other (Publisher, Runner, etc.) Configuration is valid.
Starting run with id c1d9413a-8191-4f4a-92bb-0fc42b5499e3
If validation fails, you’ll see error messages instead, and the run will not proceed. Look for messages from com.kmwllc.lucille.core.Runner at ERROR level.
Phase 2: Connector Execution
For each connector, you’ll see:
Running connector {name} feeding to pipeline {pipeline}
Starting {N} worker threads for pipeline {pipeline}
If a connector has no pipeline (e.g., it performs setup work only), you’ll see feeding to pipeline NOT CONFIGURED or null.
Phase 3: Periodic Progress (During Processing)
Three types of periodic messages appear every log.seconds (default 30 seconds):
Publisher (main thread):
{N} docs published. One minute rate: {X} docs/sec. Mean connector latency: {Y} ms/doc. Waiting on {Z} docs.
WorkerPool watcher:
{N} docs processed. One minute rate: {X} docs/sec. Mean pipeline latency: {Y} ms/doc.
Indexer:
{N} docs indexed. One minute rate: {X} docs/sec. Mean backend latency: {Y} ms/doc.
Phase 4: Connector Completion
When the connector finishes publishing:
Connector complete. Waiting on {N} docs.
This means the connector thread has finished, but documents are still being processed/indexed. The system is draining.
Phase 5: Publisher Completion
When all documents reach a terminal state:
Publisher complete. Mean publishing rate: {X} docs/sec. Mean connector latency: {Y} ms/doc.
{N} docs published. {C} children created. {S} success events. {F} failure events. {D} drop events.
All documents SUCCEEDED.
Or if there were failures:
{F} documents FAILED.
Phase 6: Per-Stage Metrics
After each connector completes, per-stage metrics are logged:
Stage {name} metrics. Docs processed: {N}. Mean latency: {X} ms/doc. Children: {C}. Errors: {E}.
Phase 7: Connector Timing
Connector {name} feeding to pipeline {pipeline} complete. Time: {X} secs.
Phase 8: Run Summary
At the very end:
RUN SUMMARY: ...
Run took {X} secs.
Answering Common Questions from the Logs
Is the config valid?
Look for the four validation messages at the start. If any say something other than “is valid,” the config has errors. The error messages will describe what’s wrong.
Did the connectors and pipelines start successfully?
Look for "Starting {N} worker threads for pipeline {name}". If this message appears, the WorkerPool started successfully (all Stage start() methods completed without error). If a stage fails to start, you’ll see an ERROR before this message and the run will abort.
How many connectors were run?
Count the "Running connector {name} feeding to pipeline {pipeline}" messages. If the run aborted early, later connectors won’t appear.
Which stages created the most latency?
Look at the per-stage metrics at the end of each connector’s execution:
Stage extract-entities metrics. Docs processed: 500000. Mean latency: 9.2441 ms/doc.
Stage normalize-scores metrics. Docs processed: 500000. Mean latency: 2.3383 ms/doc.
Stage clean-whitespace metrics. Docs processed: 500000. Mean latency: 0.0147 ms/doc.
Sort by mean latency to find bottlenecks. In this example, extract-entities at 9.24 ms/doc dominates the pipeline.
What errors occurred?
Search for log.level":"ERROR" or log.level":"WARN". Common patterns:
"Document FAILED"— common prefix for all document failures (pipeline processing, indexing, poison pills)"Document FAILED during pipeline processing: {id}"— a stage threw an exception for a specific document"Document FAILED during indexing: {id}"— the indexer failed to index a specific document"Document FAILED: retry count exceeded for {id}"— poison pill, document exceeded max retries"Error sending documents to index"— a batch failed at the indexer"Worker has not polled in {N} seconds"— a worker appears stuck"Connector failed to perform pre execution actions"— preExecute threw
Which documents failed?
The run summary reports how many documents failed but does not list their IDs. To identify specific failed documents, search the logs for failure messages. These are logged at ERROR level by the DocLogger and are visible in the default logging configuration without any changes.
All document failures use a standardized "Document FAILED" prefix. To find every failed document in one pass:
grep "Document FAILED" lucille.log
To narrow down by failure type:
Pipeline failures (a stage threw StageException):
grep "Document FAILED during pipeline processing:" lucille.log
Each match includes the document ID and is followed by a stack trace showing which stage failed and why.
Indexer failures (the search backend rejected the document):
grep "Document FAILED during indexing:" lucille.log
Each match includes the document ID and the reason (e.g., mapping error, version conflict).
Poison pills (distributed mode only — document exceeded worker.maxRetries):
grep "Document FAILED: retry count exceeded" lucille.log
These documents were sent to the {pipeline}_fail Kafka topic. Consume that topic to retrieve the full document content for inspection or replay.
In structured/JSON logging, filter by the id MDC field and ERROR level:
jq 'select(.level == "ERROR" and .id != null)' lucille-json.log
In test mode (Java), use the RunResult API to get failed document IDs programmatically:
RunResult result = Runner.runInTestMode(config);
List<Event> events = result.getEvents("my-connector");
List<String> failedIds = events.stream()
    .filter(e -> e.getType() == Event.Type.FAIL)
    .map(Event::getDocumentId)
    .collect(Collectors.toList());
Tip: To trace a specific document’s full journey through the pipeline (every stage entry and exit), lower the DocLogger to INFO level in your log4j2.xml. This is extremely verbose and should be routed to a separate file in production:
<Logger name="com.kmwllc.lucille.core.DocLogger" level="INFO" additivity="false">
    <AppenderRef ref="doclogger-file" />
</Logger>
Where is latency introduced?
Three distinct latency measurements appear in the periodic logs:
Connector latency (Publisher message): Mean connector latency: 0.13 ms/doc
- Time between consecutive
publish()calls. Measures how fast the connector produces documents from the source system.
Pipeline latency (WorkerPool message): Mean pipeline latency: 11.06 ms/doc
- Time to process one document through all stages. This is the CPU-bound enrichment work.
Backend latency (Indexer message): Mean backend latency: {X} ms/doc
- Time per document for the search engine to accept a batch (total batch time / batch size).
What does “Waiting on {N} docs” mean?
This is the Publisher’s pending count — documents that have been published but haven’t yet reached a terminal state (indexed, failed, or dropped). If this number stays constant while the connector is still running, it means maxPendingDocs backpressure is active and the connector is blocked waiting for downstream components to catch up.
If the run is not complete yet, what are we waiting for?
Look at the most recent Publisher message:
"Waiting on {N} docs"— N documents are still in-flight (being processed or indexed)"Connector complete. Waiting on {N} docs"— the connector finished publishing, but N documents haven’t completed yet
If the “Waiting on” count is not decreasing over time, something is stuck. Check for:
- Worker stuck messages (
"Worker has not polled in...") - Indexer showing 0 docs indexed (backend might be unreachable)
- No new WorkerPool stats appearing (workers might have crashed)
Understanding “One Minute Rate”
The “one minute rate” is an exponentially weighted moving average (EWMA) computed by the Codahale Metrics library. It is NOT a simple count of events in the last 60 seconds.
How it works:
- The EWMA is updated every 5 seconds with the number of events since the last update
- It applies exponential decay with a 1-minute half-life
- Recent events are weighted more heavily than older events
Implications:
- At the start of a run, the one-minute rate ramps up gradually (it takes ~60 seconds to reach steady state)
- After a burst, the rate decays gradually rather than dropping instantly
- It’s a smoothed approximation of throughput, not an exact count
The rate represents the aggregate throughput across all threads for that component. If 4 worker threads are each processing 85 docs/sec, the one-minute rate shows ~340 docs/sec.
Understanding Latency Numbers in a Multithreaded System
Pipeline latency (Mean pipeline latency: 11.06 ms/doc) is the average time a single document spends being processed through all stages. This is measured per-document, per-thread. It does NOT include time spent waiting in the queue.
With 4 worker threads and 11 ms/doc pipeline latency, the theoretical throughput is:
4 threads × (1000 ms / 11 ms) = ~364 docs/sec
This matches the observed one-minute rate of ~345 docs/sec (the difference is queue polling overhead and other bookkeeping).
Connector latency (Mean connector latency: 0.13 ms/doc) is the average time between consecutive publish() calls on the connector thread. Low values mean the connector is producing documents faster than the pipeline can consume them (the connector is not the bottleneck).
Backend latency is the average time per document for the search engine to process a batch. If this is 0.00 ms/doc and 0 docs indexed, the indexer hasn’t flushed a batch yet (documents are still accumulating, or the pipeline is dropping all documents before they reach the indexer).
Why Different Stages Process Different Numbers of Documents
In the per-stage metrics, you might see:
Stage create-grouping-key metrics. Docs processed: 500000.
Stage apply-category-filter metrics. Docs processed: 1247.
Stage enrich-metadata metrics. Docs processed: 175000.
This happens because of conditional execution. Each stage can have a conditions block that determines whether it processes a given document. A stage with conditions that match only a subset of documents will show a lower count. In this example:
create-grouping-keyprocesses all 500,000 documents (no conditions, or conditions that always match)apply-category-filterprocesses only 1,247 documents (its conditions match only a small subset)enrich-metadataprocesses 175,000 documents (its conditions match about a third)
This is normal and expected. It does NOT indicate errors or skipped documents.
The RUN SUMMARY
At the end of a complete run, the Runner logs a structured summary including:
- Overall status (success/failure)
- Number of connectors executed
- Per-connector results (success/failure, duration, document counts)
- Total documents published, succeeded, failed, dropped
- Total run duration
If a connector failed, the summary indicates which one and why. Subsequent connectors are listed as skipped.
What Is WorkerWatcherExecutorService?
The WorkerWatcherExecutorService is a daemon thread started by the WorkerPool. It runs a scheduled task every 500ms that:
- Logs periodic pipeline statistics (every
log.seconds): docs processed, one-minute rate, mean latency - Detects stuck workers: checks each worker’s last poll timestamp; if any worker hasn’t polled within
worker.maxProcessingSecs, logs an error - Emits heartbeats (if
worker.enableHeartbeatis true): writes to the heartbeat logger for Kubernetes liveness probes
The thread name includes the run ID: Lucille-{runId}-WorkerWatcherExecutorService. It’s a daemon thread, so it doesn’t prevent JVM shutdown.
Single-JVM vs. Distributed Deployment Logs
Single-JVM (LOCAL mode)
All components log to the same output (console/file). You see interleaved messages from Runner, Publisher, Workers, Indexer, and the Watcher — all in one stream. The run_id is the same across all messages. Thread names distinguish components.
Distributed Deployment
Each process has its own log output:
Runner process — sees: validation messages, connector start/stop, Publisher messages (docs published, waiting on N, completion), per-stage metrics, run summary. Does NOT see worker or indexer processing messages.
Worker process(es) — each Worker JVM sees: its own WorkerPool stats (docs processed, pipeline latency), its own WorkerWatcherExecutorService messages, any stage-level warnings/errors for documents it processes. Each Worker JVM reports statistics only for the threads in that JVM. If you have 3 Worker JVMs each with 4 threads, each JVM’s logs show the throughput of its own 4 threads, not the aggregate.
Indexer process(es) — each Indexer JVM sees: its own indexing stats (docs indexed, backend latency), any batch errors. Each Indexer reports only its own throughput.
To get aggregate statistics in distributed mode, you need to sum across all Worker/Indexer logs, or use a log aggregation tool that can filter by run_id and aggregate metrics.
Common Log Patterns and What They Mean
“First doc published after {N} ms”
Time from when the connector started to when the first document was published. High values indicate slow connector initialization (e.g., establishing a database connection, listing files in S3).
“0 docs indexed. One minute rate: 0.00 docs/sec.”
The Indexer hasn’t flushed a batch yet. This is normal early in a run (documents are still accumulating in the batch) or when all documents are being dropped by the pipeline before reaching the Indexer.
“Connector complete. Waiting on {N} docs.”
The connector finished publishing all documents. The system is now draining — processing and indexing the remaining in-flight documents. The “Waiting on” count should decrease over time until it reaches 0.
“Publisher complete.”
All documents have reached a terminal state. The run is done (for this connector).
“All documents SUCCEEDED.” / “{N} documents FAILED.”
Final accounting. “SUCCEEDED” means all documents were either indexed or intentionally dropped. “FAILED” means some documents encountered errors.
“{N} drop events”
Documents that were intentionally dropped by the pipeline (via the drop flag). Dropped documents are counted as successful completions — they reached their intended terminal state.
WARN messages during Stage start()
Warnings emitted during stage initialization (e.g., dictionary conflicts, missing optional resources). These appear on the main thread because start() is called during WorkerPool startup. They appear once per worker thread (so 4 workers = 4 identical warnings).
“Document FAILED during pipeline processing: {id}”
A stage threw a StageException for this document. The document is failed and processing continues. Look for the stack trace immediately following this message.
Tips for Log Analysis
- Filter by thread name to isolate one component’s messages.
- Filter by
run_id(in JSON mode) to isolate one run in a system that runs multiple ingests. - Watch the “Waiting on” count — if it’s not decreasing, something is stuck.
- Compare connector rate vs. pipeline rate — if the connector is much faster, the pipeline is the bottleneck. If they’re similar, the connector might be the bottleneck.
- Look at per-stage metrics to find which stage dominates pipeline latency.
- Check for stages with error counts > 0 — these indicate documents that failed at specific stages.
- In distributed mode, remember that each JVM’s stats are local. Aggregate across JVMs for the full picture.
- The DocLogger (if enabled at INFO level) provides per-document tracing — every stage entry/exit for every document. This is extremely verbose but invaluable for debugging a specific document’s journey. Route it to a separate file in production.
5 - Performance Tuning
Before You Optimize: Choosing the Right Deployment Mode
Distributed mode provides a pathway to higher throughput by running multiple Worker and Indexer processes across machines. However, there is inherent overhead in serializing and deserializing documents across Kafka and process boundaries — every document is converted to JSON, written to Kafka, read from Kafka, and parsed back into a Document object at each hop.
Distributed mode is not necessary or justified for all projects. For a small ingestion task (thousands to low millions of documents with lightweight enrichment), local single-JVM mode is often sufficient and faster end-to-end than distributed mode because it avoids all serialization overhead. The in-memory queues in local mode have near-zero latency compared to Kafka round-trips.
Consider distributed mode when:
- Pipeline processing is CPU-bound and a single machine’s cores are saturated
- The ingest volume is large enough that the serialization overhead is amortized across many documents
- You need fault tolerance (crash recovery via Kafka redelivery)
- You need to scale Workers independently of the Connector or Indexer
Consider local mode when:
- The ingest completes in a reasonable time on a single machine
- The pipeline is I/O-bound (calling external APIs) rather than CPU-bound — adding threads in local mode is simpler than adding processes
- The operational complexity of Kafka is not justified for the workload
- You’re in development or testing
You can always start in local mode and move to distributed later without changing pipeline code — the transition is a command-line flag, not a rewrite.
Reducing Document Size
Documents flow through queues, are serialized to Kafka (in distributed mode), and are held in memory during processing. Smaller documents mean less memory consumption, less data transfer, and faster serialization. This is one of the highest-leverage optimizations available.
Remove Unnecessary Fields Early
If a field is not needed by downstream stages or the search backend, remove it as early as possible:
Best: Don’t populate it in the Connector. If the Connector reads from a database, only SELECT the columns you need. If it reads files, don’t load file_content unless a downstream stage requires it.
Second best: Remove it at the beginning of the pipeline. Use DeleteFields as one of the first stages:
stages: [
  {
    class: "com.kmwllc.lucille.stage.DeleteFields"
    fields: ["raw_html", "debug_info", "internal_metadata"]
  },
  // ... remaining stages that don't need those fields
]
After extraction: Remove large intermediate fields. If a stage extracts text from file_content, delete file_content immediately after — it’s no longer needed and may be megabytes per document:
stages: [
  {
    class: "com.kmwllc.lucille.tika.stage.TextExtractor"
    byteArrayField: "file_content"
    dest: "body"
  },
  {
    class: "com.kmwllc.lucille.stage.DeleteFields"
    fields: ["file_content"]
  },
  // ... remaining stages operate on "body", not the raw bytes
]
Consider Whether Data Needs to Live on the Document
Not all data needs to be carried on the Document itself. Consider whether a reference (file path, URL, database key) is sufficient instead of the actual content:
- If a stage needs to read a file, the Connector can store the file path on the document and the stage can read the file directly — rather than the Connector loading the entire file into a
byte[]field. - If a stage needs to query an API, it can use an ID or URL stored on the document to make the call at processing time — rather than the Connector pre-fetching all API responses.
- If the search backend doesn’t need the raw content (only extracted/enriched fields), don’t carry the raw content through the entire pipeline.
This is especially important in distributed mode where every byte on the document is serialized to Kafka at each hop. A 10MB PDF binary on a document means 10MB written to the source topic, 10MB read by the Worker, 10MB written to the dest topic, and 10MB read by the Indexer — 40MB of I/O for content that might only be needed by one stage.
Using Conditional Execution to Avoid Unnecessary Work
Every Stage supports a conditions block that controls whether it executes for a given document. Use this to ensure expensive stages are not applied to documents that don’t need them:
stages: [
  {
    class: "com.kmwllc.lucille.tika.stage.TextExtractor"
    byteArrayField: "file_content"
    conditions: [
      { fields: ["file_content"], operator: "must" }
    ]
  },
  {
    class: "com.kmwllc.lucille.stage.OpenAIEmbed"
    source: "body"
    conditions: [
      { fields: ["body"], operator: "must" }
      { fields: ["content_type"], values: ["article", "page"], operator: "must" }
    ]
    conditionPolicy: "all"
  }
]
In this example:
TextExtractoronly runs on documents that actually havefile_content— documents without it skip the stage entirely (zero cost).OpenAIEmbedonly runs on documents that have abodyfield AND acontent_typeof “article” or “page” — other documents skip the expensive embedding call.
This is free performance. Conditional execution is evaluated in the base Stage class before processDocument() is called. There is no overhead for documents that don’t match — they are simply not processed by that stage. For pipelines that handle heterogeneous documents (some with files, some without; some needing embeddings, some not), conditions can dramatically reduce the average pipeline latency.
Parallelizing Multiple Pipelines
If your ingest involves multiple pipelines (e.g., one for database records, one for files, one for an API source), consider whether they need to run sequentially or can run in parallel.
Sequential Pipelines (Single Config)
Use a single Lucille config with multiple connector/pipeline pairs when:
- One pipeline’s output is a dependency for another (e.g., parent documents must be indexed before child documents that reference them)
- You need a single run_id across all pipelines for unified accounting and log correlation
- You want a single run summary that reports success/failure across all connectors
connectors: [
  { name: "parents", class: "...", pipeline: "parent-pipeline" },
  { name: "children", class: "...", pipeline: "child-pipeline" }
]

pipelines: [
  { name: "parent-pipeline", stages: [...] },
  { name: "child-pipeline", stages: [...] }
]
In this configuration, parents completes fully (all documents indexed) before children starts. All documents share a single run_id.
Parallel Pipelines (Separate Configs)
If your pipelines don’t depend on each other, you can run them in parallel with separate Lucille configs launched via separate Runner invocations:
#!/bin/bash
# Run three independent pipelines in parallel
java -Dconfig.file=conf/database-ingest.conf -cp 'target/lib/*' com.kmwllc.lucille.core.Runner &
java -Dconfig.file=conf/file-ingest.conf -cp 'target/lib/*' com.kmwllc.lucille.core.Runner &
java -Dconfig.file=conf/api-ingest.conf -cp 'target/lib/*' com.kmwllc.lucille.core.Runner &
wait
echo "All ingests complete"
Each invocation gets its own run_id, its own Publisher, its own Workers, and its own run summary. They execute concurrently and independently.
Tradeoffs:
- Pro: Total wall-clock time is reduced (pipelines overlap instead of running sequentially)
- Pro: Each pipeline can be tuned independently (different thread counts, batch sizes)
- Pro: A failure in one pipeline doesn’t abort the others
- Con: Each run has a separate
run_id— you can’t correlate all documents from a single “ingest session” by run_id - Con: If pipelines write to the same index, you must ensure their document IDs don’t collide (use
docIdPrefix) - Con: Resource contention — multiple JVMs competing for CPU, memory, and search backend capacity
When to Choose Each Approach
| Scenario | Approach |
|---|---|
| Pipeline B depends on Pipeline A’s output | Sequential (single config) |
| Need unified run accounting across all pipelines | Sequential (single config) |
| Pipelines are independent, wall-clock time matters | Parallel (separate configs) |
| Different pipelines need different Worker thread counts | Parallel (separate configs) |
| Running on a machine with many cores and plenty of memory | Parallel (separate configs) |
| Running on a constrained machine | Sequential (single config) to avoid resource contention |
Understanding Where Time Is Spent
Lucille’s concurrent architecture means three things happen simultaneously: the Connector reads from the source, Workers process documents through the Pipeline, and the Indexer sends batches to the search backend. The overall throughput is limited by whichever component is slowest.
The periodic log messages tell you which component is the bottleneck:
INFO PublisherImpl: 80230 docs published. One minute rate: 483.11 docs/sec. Mean connector latency: 0.10 ms/doc. Waiting on 10019 docs.
INFO WorkerPool: 81269 docs processed. One minute rate: 390.46 docs/sec. Mean pipeline latency: 9.82 ms/doc.
INFO Indexer: 17016 docs indexed. One minute rate: 455.07 docs/sec. Mean backend latency: 6.90 ms/doc.
Interpreting the Numbers
Connector rate (Publisher message): How fast the Connector produces documents. A very low connector latency (< 1 ms/doc) means the Connector is not the bottleneck — it’s producing faster than downstream can consume.
Pipeline rate (WorkerPool message): How fast Workers process documents through all Stages. This is the aggregate rate across all Worker threads.
Indexer rate (Indexer message): How fast the search backend accepts batches.
“Waiting on N docs”: The number of documents currently in flight (published but not yet indexed or failed). If this number is consistently at maxPendingDocs or queueCapacity, the Connector is being throttled by backpressure — downstream is the bottleneck.
Identifying the Bottleneck
| Symptom | Bottleneck | Action |
|---|---|---|
| Pipeline rate « Connector rate, “Waiting on” at max | Pipeline (CPU-bound) | Add Worker threads or Worker processes |
| Indexer rate « Pipeline rate | Search backend (I/O-bound) | Tune batch size, add Indexer processes, or scale the backend |
| Connector rate « Pipeline rate, “Waiting on” is low | Connector (source I/O) | Optimize source queries, add parallelism in Connector |
| All rates similar and low | Likely a single slow Stage | Check per-stage metrics at end of run |
Per-Stage Bottleneck Analysis
At the end of each connector’s execution, Lucille logs per-stage metrics:
Stage text-extraction metrics. Docs processed: 500000. Mean latency: 45.2 ms/doc. Children: 0. Errors: 0.
Stage entity-recognition metrics. Docs processed: 500000. Mean latency: 12.8 ms/doc. Children: 0. Errors: 0.
Stage copy-fields metrics. Docs processed: 500000. Mean latency: 0.003 ms/doc. Children: 0. Errors: 0.
Sort by mean latency to find the dominant stage. In this example, text-extraction at 45.2 ms/doc accounts for ~78% of the total pipeline latency. Optimizing or parallelizing this stage would have the most impact.
What the Latency Numbers Mean in a Multithreaded System
Pipeline latency is measured per-document, per-thread. It does NOT include time spent waiting in the queue. With N Worker threads:
theoretical max throughput = N threads × (1000 ms / mean_pipeline_latency_ms)
Example: 4 threads × (1000 / 9.82) = ~407 docs/sec. If the observed rate is significantly lower than this theoretical max, something else is constraining throughput (queue contention, GC pauses, or the Indexer not consuming fast enough).
Why Different Stages Process Different Document Counts
If you see:
Stage extract-text metrics. Docs processed: 500000.
Stage apply-geo-filter metrics. Docs processed: 1247.
This is conditional execution — the second stage has conditions that match only a subset of documents. This is normal and expected, not an error.
Tuning Worker Threads
When to Add Threads
Add Worker threads when the pipeline is CPU-bound (pipeline rate is the bottleneck) and the machine has spare CPU cores.
worker {
  threads: 8  # default is 1
}
Diminishing Returns
Each Worker thread creates its own Pipeline instance with its own Stage instances. If a Stage loads a large model (e.g., 500MB NLP model), each thread loads its own copy. With 8 threads, that’s 4GB of model memory.
Monitor CPU utilization and memory. If adding threads doesn’t increase throughput proportionally, you’ve hit either:
- Memory limits (GC pressure from too many model copies)
- I/O limits (all threads waiting on the same external service)
- Queue contention (unlikely with Lucille’s design, but possible at very high thread counts)
Per-Pipeline Thread Configuration
Threads can be configured per-pipeline rather than globally:
pipelines: [
  {
    name: "heavy-pipeline"
    threads: 8
    stages: [...]
  },
  {
    name: "light-pipeline"
    threads: 2
    stages: [...]
  }
]
Tuning Indexer Batching
Batch Size
Larger batches mean fewer API calls to the search backend, which generally improves throughput:
indexer {
  batchSize: 500  # default is 100
}
However, larger batches also mean:
- More memory used to hold the batch
- Higher latency before documents appear in the index (they wait longer in the batch)
- Larger blast radius if a batch fails (all documents in the batch fail)
Batch Timeout
The timeout ensures documents are flushed even when volume is low:
indexer {
  batchTimeout: 5000  # milliseconds; default is 100
}
A higher timeout allows more documents to accumulate (better throughput) but increases the time between a document being processed and appearing in the index.
Recommended Starting Points
| Scenario | batchSize | batchTimeout |
|---|---|---|
| High-volume batch ingest | 500–2000 | 5000–10000 ms |
| Low-volume incremental | 50–100 | 100–500 ms |
| Streaming (low latency) | 50–100 | 100 ms |
| Large documents (>1MB each) | 10–50 | 1000 ms |
Scaling in Distributed Mode
Adding Workers
In Kafka-distributed mode, adding Worker processes increases throughput proportionally (up to the number of source topic partitions):
# Start additional Worker processes
java -Dconfig.file=config.conf -cp 'target/lib/*' com.kmwllc.lucille.core.Worker my-pipeline
Each Worker joins the same Kafka consumer group. Kafka distributes partitions automatically.
Maximum parallelism = number of partitions on the source topic. If you have 8 partitions, at most 8 Workers can consume concurrently. To scale beyond this, increase the partition count on the source topic.
Adding Workers While Running
Workers can be added to a running ingest. The new Worker joins the consumer group, triggers a rebalance, and begins consuming from assigned partitions immediately. No restart required.
WorkerIndexer for Reduced Overhead
If the Indexer is not a separate bottleneck, use WorkerIndexer to avoid the Kafka round-trip between Worker and Indexer:
java -Dconfig.file=config.conf -cp 'target/lib/*' com.kmwllc.lucille.core.WorkerIndexer my-pipeline
Each WorkerIndexer process pairs one Worker with one Indexer, communicating via an in-memory queue. Scale by adding more WorkerIndexer processes.
Backpressure Tuning
Local Mode: Queue Capacity
publisher {
  queueCapacity: 10000  # default
}
This bounds the in-memory processing and indexing queues. If the Connector publishes faster than Workers consume, publish() blocks when the queue is full. Increasing this allows more documents to buffer in memory (higher throughput burst capacity) at the cost of memory.
Distributed Mode: Max Pending Docs
publisher {
  maxPendingDocs: 80000
}
This blocks the Connector when too many documents are in flight (published but not yet terminal). Without this, a fast Connector can publish millions of documents onto Kafka before Workers process them, consuming Kafka storage and potentially causing consumer lag issues.
Rule of thumb: Set maxPendingDocs to roughly 2–5× the number of documents your Workers can process per minute.
Memory Tuning
Heap Sizing
Always set -Xmx explicitly:
java -Xmx4g -Dconfig.file=config.conf -cp 'target/lib/*' com.kmwllc.lucille.core.Runner
Memory Budget
| Component | Memory Driver |
|---|---|
| Worker threads | Stage resources × number of threads (models, connections, caches) |
| Queue capacity | queueCapacity × average document size |
| Indexer batch | batchSize × average document size |
| Document overhead | Jackson ObjectNode per document in flight |
Symptoms of Insufficient Memory
- Frequent GC pauses (visible as throughput drops in periodic stats)
OutOfMemoryError(fatal — process crashes)- Throughput that decreases over time (GC pressure increasing as heap fills)
Reducing Memory Usage
- Reduce
worker.threads(fewer model copies) - Reduce
publisher.queueCapacity(fewer buffered documents) - Reduce
indexer.batchSize(smaller batches in memory) - Use singleton pattern for large shared resources (see Quick Reference: Threading Model)
- Delete large fields (e.g.,
file_content) after extraction stages are done with them
Optimizing Specific Stages
Stages That Call External Services
Stages that make HTTP calls, query databases, or call APIs are typically I/O-bound. Adding Worker threads helps because threads can overlap their I/O waits:
worker {
  threads: 16  # high thread count for I/O-bound pipelines
}
Stages That Load Models
Stages that load ML models (JLama, OpenNLP) are memory-bound. Each thread loads its own model copy. Consider:
- Using the singleton pattern (
DictionaryManagerapproach) for thread-safe models - Reducing thread count to fit within memory
- Using a smaller/quantized model
Stages That Generate Children
Stages like ChunkText that generate many children per document can create throughput spikes. The lazy iterator model prevents memory issues, but the downstream stages must process all children before the next parent document is pulled. If children are expensive to process (e.g., embedding generation per chunk), the effective throughput per parent document is:
time_per_parent = pipeline_latency × (1 + number_of_children)
To improve this: reduce chunk count (larger chunks), or add more Worker threads to parallelize across parents.
Kafka Tuning for Distributed Mode
maxPollIntervalSecs
kafka {
  maxPollIntervalSecs: 600  # 10 minutes
}
This is the maximum time between Kafka poll() calls before the consumer is evicted from the group. If a single document takes longer than this to process, the Worker is kicked from the group and the document is redelivered to another Worker.
Set this higher than your slowest expected document processing time. If you have stages that call slow external APIs or process very large documents, increase this value.
maxRequestSize
kafka {
  maxRequestSize: 250000000  # 250MB
}
The maximum size of a single Kafka message. If your documents are large (e.g., containing extracted PDF text or binary content), this must be large enough to hold the largest document after JSON serialization.
Partition Count
More partitions = more potential parallelism. The source topic’s partition count is the upper bound on Worker parallelism.
Rule of thumb: Set partition count to at least 2× the maximum number of Workers you expect to run. This gives room to scale without repartitioning.
Warning: Lucille does not auto-create the source or dest topics. If Kafka auto-creates them (via broker auto.create.topics.enable), the default partition count is typically 1 — meaning only one Worker thread will receive work regardless of how many you configure. Pre-create topics with the desired partition count, or set the broker’s num.partitions appropriately. See the Kafka Integration internals page for details.
Monitoring Performance Over Time
Key Metrics to Watch
During a run, track these from the periodic log messages:
- One minute rate (docs/sec) — is it stable, increasing, or decreasing?
- “Waiting on” count — is it at the max (backpressure active) or low (Connector is the bottleneck)?
- Mean pipeline latency — is it stable or increasing over time? (Increasing suggests memory pressure or external service degradation)
- Mean backend latency — is the search engine keeping up?
Signs of a Healthy Run
- One minute rates are stable after the initial ramp-up period (~60 seconds)
- “Waiting on” count is between 0 and
maxPendingDocs(not pegged at either extreme) - Pipeline latency is stable
- No ERROR messages in logs
Signs of Trouble
- One minute rate decreasing over time → memory pressure or external service degradation
- “Waiting on” pegged at max → pipeline or indexer is the bottleneck
- “Waiting on” at 0 → connector is the bottleneck (or it’s finished)
- Pipeline latency increasing → GC pressure, external service slowing down, or resource exhaustion
- Indexer showing 0 docs indexed → backend unreachable or all documents being dropped before reaching indexer
Performance Checklist
- Consider whether local mode is sufficient before adopting distributed mode
- If running multiple pipelines, decide whether they should be sequential (single config) or parallel (separate configs)
- Identify the bottleneck (Connector, Pipeline, or Indexer) from periodic log messages
- Check per-stage metrics to find the slowest stage
- Use conditional execution (
conditionsblocks) to skip expensive stages for documents that don’t need them - Remove unnecessary fields early — ideally don’t populate them in the Connector; otherwise use
DeleteFieldsat the start of the pipeline - Consider whether large data (file content, binary blobs) needs to live on the document or whether a path/URL reference is sufficient
- Delete large intermediate fields (e.g.,
file_content) immediately after the stage that needs them - Set
worker.threadsappropriate for your pipeline’s CPU/memory profile - Set
indexer.batchSizeandbatchTimeoutfor your backend’s optimal batch size - Set
-Xmxheap size with headroom for GC - In distributed mode: ensure source topic partition count >= desired Worker count
- Set
kafka.maxPollIntervalSecshigher than your slowest document processing time - Set
publisher.maxPendingDocsorpublisher.queueCapacityto prevent memory exhaustion - Monitor for increasing latency over time (indicates resource pressure)
6 - Security Configuration
Lucille connects to external systems — search backends (Solr, OpenSearch, Elasticsearch, Pinecone) and Kafka — that may require TLS encryption and authentication. This page covers how to configure security for each.
General Principles
Never hard-code credentials in config files. Use HOCON’s environment variable substitution to inject secrets at runtime:
opensearch {
  url: "https://localhost:9200"
  url: ${?OPENSEARCH_URL}  # override from env var
}
In Kubernetes, inject credentials via Secrets mounted as environment variables. In Docker, use --env or --env-file. The config file can live in version control with defaults; secrets come from the environment.
Use acceptInvalidCert: false in production. The acceptInvalidCert option exists for development against localhost with self-signed certificates. In production, always use valid certificates and leave this disabled.
OpenSearch / Elasticsearch Security
URL-Based Authentication
The simplest approach: embed credentials in the URL:
opensearch {
  url: "https://admin:password@opensearch-host:9200"
  url: ${?OPENSEARCH_URL}
  index: "my-index"
}
Lucille’s OpenSearchUtils parses the userInfo from the URL and configures HTTP Basic authentication automatically. The username and password are extracted and applied to all requests.
TLS Configuration
OpenSearch connections use TLS when the URL scheme is https://. Lucille builds an SSL context and TLS strategy for the HTTP client automatically.
For valid certificates (production):
opensearch {
  url: "https://opensearch-host:9200"
  index: "my-index"
  acceptInvalidCert: false  # default — validates certificates normally
}
No additional configuration needed if the server’s certificate is signed by a CA in the JVM’s default trust store.
For self-signed certificates (development only):
opensearch {
  url: "https://localhost:9200"
  index: "my-index"
  acceptInvalidCert: true  # disables certificate validation and hostname verification
}
When acceptInvalidCert: true, Lucille:
- Trusts all certificates (including self-signed)
- Disables hostname verification (
NoopHostnameVerifier)
Warning: Never use acceptInvalidCert: true in production. It disables all TLS security guarantees.
Custom Trust Store
If your OpenSearch cluster uses certificates signed by an internal CA not in the JVM’s default trust store, provide a custom trust store via JVM system properties:
java \
  -Djavax.net.ssl.trustStore=/path/to/truststore.jks \
  -Djavax.net.ssl.trustStorePassword=changeit \
  -Dconfig.file=config.conf \
  -cp 'target/lib/*' com.kmwllc.lucille.core.Runner
Or configure via HOCON (Lucille sets these as system properties if not already set):
javax.net.ssl.trustStore: "/path/to/truststore.jks"
javax.net.ssl.trustStore: ${?TRUSTSTORE_PATH}
javax.net.ssl.trustStorePassword: "changeit"
javax.net.ssl.trustStorePassword: ${?TRUSTSTORE_PASSWORD}
Solr Security
HTTP Basic Authentication
solr {
  url: "https://solr-host:8983/solr/my-collection"
  userName: "solr-user"
  userName: ${?SOLR_USER}
  password: "solr-password"
  password: ${?SOLR_PASSWORD}
}
TLS with Custom Keystore/Truststore
For Solr clusters with mutual TLS (mTLS) or custom CA certificates:
solr {
  url: "https://solr-host:8983/solr/my-collection"
  userName: ${?SOLR_USER}
  password: ${?SOLR_PASSWORD}
  acceptInvalidCert: false
}

# SSL system properties — Lucille sets these if not already set via -D flags
javax.net.ssl.keyStore: "/path/to/keystore.jks"
javax.net.ssl.keyStore: ${?KEYSTORE_PATH}
javax.net.ssl.keyStorePassword: "changeit"
javax.net.ssl.keyStorePassword: ${?KEYSTORE_PASSWORD}
javax.net.ssl.trustStore: "/path/to/truststore.jks"
javax.net.ssl.trustStore: ${?TRUSTSTORE_PATH}
javax.net.ssl.trustStorePassword: "changeit"
javax.net.ssl.trustStorePassword: ${?TRUSTSTORE_PASSWORD}
Lucille’s SSLUtils.setSSLSystemProperties(config) reads these from the config and sets them as JVM system properties (without overriding properties already set via -D flags). This means you can provide them either in the config file or on the command line.
SolrCloud with ZooKeeper
For SolrCloud deployments, the Solr client connects to ZooKeeper for cluster state. If ZooKeeper requires authentication, configure it separately (ZooKeeper auth is not managed by Lucille’s config — use ZooKeeper’s own client configuration mechanisms).
solr {
  useCloudClient: true
  zkHosts: ["zk1:2181", "zk2:2181", "zk3:2181"]
  zkChroot: "/solr"
  defaultCollection: "my-collection"
  userName: ${?SOLR_USER}
  password: ${?SOLR_PASSWORD}
}
Development: Accepting Invalid Certificates
solr {
  url: "https://localhost:8983/solr/my-collection"
  acceptInvalidCert: true  # development only
}
Kafka Security
Security Protocol
Kafka supports four security protocols. Set the protocol in the kafka config block:
kafka {
  bootstrapServers: "kafka-host:9093"
  securityProtocol: "SSL"  # or PLAINTEXT, SASL_PLAINTEXT, SASL_SSL
}
| Protocol | Encryption | Authentication |
|---|---|---|
PLAINTEXT | None | None |
SSL | TLS | TLS client certificates (optional) |
SASL_PLAINTEXT | None | SASL (username/password, Kerberos, etc.) |
SASL_SSL | TLS | SASL over TLS |
Using External Property Files
For complex Kafka security configurations (SASL mechanisms, Kerberos, custom SSL settings), use external property files:
kafka {
  bootstrapServers: "kafka-host:9093"
  securityProtocol: "SASL_SSL"
  consumerPropertyFile: "/path/to/consumer.properties"
  producerPropertyFile: "/path/to/producer.properties"
  adminPropertyFile: "/path/to/admin.properties"
}
When a property file is specified, it completely replaces the programmatic Kafka client configuration (except for CLIENT_ID_CONFIG which is always set by Lucille). This gives you full control over every Kafka client property.
Example consumer.properties for SASL_SSL with SCRAM-SHA-256:
security.protocol=SASL_SSL
sasl.mechanism=SCRAM-SHA-256
sasl.jaas.config=org.apache.kafka.common.security.scram.ScramLoginModule required \
  username="kafka-user" \
  password="kafka-password";
ssl.truststore.location=/path/to/truststore.jks
ssl.truststore.password=changeit
ssl.endpoint.identification.algorithm=https
Example consumer.properties for SSL with client certificates (mTLS):
security.protocol=SSL
ssl.truststore.location=/path/to/truststore.jks
ssl.truststore.password=changeit
ssl.keystore.location=/path/to/keystore.jks
ssl.keystore.password=changeit
ssl.key.password=changeit
ssl.endpoint.identification.algorithm=https
Property File Loading
Lucille loads property files via FileContentFetcher, which supports:
- Local filesystem paths (
/path/to/file.properties) - S3 paths (
s3://bucket/path/to/file.properties) - Azure Blob paths
- GCS paths
This means you can store Kafka property files in cloud storage and reference them from the config — useful for centralized secret management.
Minimal SSL Configuration (Without Property Files)
For simple SSL setups where you only need to set the security protocol:
kafka {
  bootstrapServers: "kafka-host:9093"
  securityProtocol: "SSL"
  consumerGroupId: "lucille_workers"
  maxPollIntervalSecs: 600
  maxRequestSize: 250000000
}
If the Kafka broker’s certificate is signed by a CA in the JVM’s default trust store, this is sufficient. For custom CAs, provide the trust store via JVM system properties:
java \
  -Djavax.net.ssl.trustStore=/path/to/kafka-truststore.jks \
  -Djavax.net.ssl.trustStorePassword=changeit \
  -Dconfig.file=config.conf \
  -cp 'target/lib/*' com.kmwllc.lucille.core.Runner
Pinecone Security
Pinecone uses API key authentication:
pinecone {
  apiKey: ${PINECONE_API_KEY}
  environment: "us-east-1-aws"
  index: "my-index"
}
All Pinecone communication uses HTTPS by default. No additional TLS configuration is needed.
Weaviate Security
Weaviate supports API key and OIDC authentication:
weaviate {
  scheme: "https"
  host: "weaviate-host:8080"
  apiKey: ${WEAVIATE_API_KEY}
  className: "MyClass"
}
Credential Management Best Practices
Environment Variable Pattern
The standard pattern for all credentials in Lucille configs:
# Default for development (or omit entirely)
opensearch.url: "http://localhost:9200"
# Override from environment in production
opensearch.url: ${?OPENSEARCH_URL}
Kubernetes Secrets
Mount secrets as environment variables in your pod spec:
env:
- name: OPENSEARCH_URL
  valueFrom:
    secretKeyRef:
      name: opensearch-credentials
      key: url
- name: KEYSTORE_PASSWORD
  valueFrom:
    secretKeyRef:
      name: tls-credentials
      key: keystore-password
Docker
Pass credentials via --env or --env-file:
docker run \
  --env OPENSEARCH_URL=https://admin:secret@opensearch:9200 \
  --env PINECONE_API_KEY=pk-abc123 \
  -it lucille-image
What NOT to Do
- ❌ Hard-code passwords in config files committed to version control
- ❌ Use
acceptInvalidCert: truein production - ❌ Store API keys in plain text in Docker images
- ❌ Use the same credentials for development and production
- ❌ Log credentials (Lucille does not log config values, but custom Connectors/Stages might)
Summary of Security Options by Backend
| Backend | Authentication | TLS | Config Location |
|---|---|---|---|
| OpenSearch | URL userinfo (Basic) | https:// scheme + acceptInvalidCert | opensearch {} block |
| Elasticsearch | URL userinfo (Basic) | https:// scheme + acceptInvalidCert | elastic {} block |
| Solr | userName + password | https:// + keystore/truststore | solr {} block |
| Kafka | securityProtocol + property files | SSL/SASL_SSL | kafka {} block |
| Pinecone | apiKey | Always HTTPS | pinecone {} block |
| Weaviate | apiKey | scheme: "https" | weaviate {} block |
| ZooKeeper | External config | External config | Not managed by Lucille |
7 - REST API
The lucille-api plugin adds an HTTP REST API built on Dropwizard that allows managing configs and triggering runs over HTTP rather than via the CLI. It includes a Swagger UI and optional basic authentication.
Current limitation: The REST API launches all runs in local mode (in-memory queues, Workers and Indexer as threads within the API server’s JVM). It cannot currently trigger a distributed Kafka-based ingest. If you need distributed mode, use the CLI Runner with -usekafka.
Maven dependency:
<dependency>
  <groupId>com.kmwllc</groupId>
  <artifactId>lucille-api</artifactId>
  <version>${lucille.version}</version>
</dependency>
Starting the API Server
The API uses a Dropwizard YAML configuration file. An example config is provided at lucille-plugins/lucille-api/conf/api.yml.
java \
  -cp 'lucille-plugins/lucille-api/target/lucille-api-{version}.jar:lucille-plugins/lucille-api/target/lib/*' \
  com.kmwllc.lucille.APIApplication server lucille-plugins/lucille-api/conf/api.yml
The server listens on port 8080 by default. Swagger UI is available at http://localhost:8080/swagger.
Endpoints
All endpoints are under the /v1 prefix.
Config Management
| Method | Path | Description |
|---|---|---|
POST | /v1/config | Submit a config as a JSON object. Returns a configId UUID. |
GET | /v1/config | List all stored configs. |
GET | /v1/config/{configId} | Retrieve a specific config by ID. |
Run Management
| Method | Path | Description |
|---|---|---|
POST | /v1/run | Start a run. Request body: {"configId": "<uuid>"}. Returns RunDetails. |
GET | /v1/run | List all runs and their status. |
GET | /v1/run/{runId} | Get details for a specific run. |
Health and Observability
| Method | Path | Description |
|---|---|---|
GET | /v1/livez | Liveness check — returns 200 if the service is running. |
GET | /v1/readyz | Readiness check — returns 200 if the service is ready. |
GET | /v1/systemstats | CPU, RAM, JVM heap, and disk usage as JSON. |
GET | /v1/systemstats/metrics | Dropwizard Codahale metrics registry as JSON. |
Typical Workflow
POST /v1/configwith your HOCON config as JSON — receive aconfigId.POST /v1/runwith{"configId": "<uuid>"}— receive arunId.GET /v1/run/{runId}— poll for run status until complete.
8 - Support Matrix
Java
| Version | Status |
|---|---|
| Java 17 | Supported (minimum required) |
| Java 21 | Supported |
Lucille is compiled targeting Java 17. Both versions are tested in CI via GitHub Actions using Eclipse Temurin distributions.
Build Tool
Apache Maven 3.x is required to build Lucille from source.
Search Backends
The following backends are supported via the Indexer component.
| Backend | Tested Version | Notes |
|---|---|---|
| Apache Solr | 9.x | Client: solr-solrj 9.8.0 |
| OpenSearch | 2.x | Client: opensearch-java 2.11.1 |
| Elasticsearch | 8.x | Client: elasticsearch-java 8.18.4 |
| CSV | — | Writes indexed documents to a local CSV file; no server required |
| Nop | — | Discards output; used for testing and dry runs |
Kafka (Distributed Mode)
| Component | Version |
|---|---|
| kafka-clients | 4.0.0 |
| Kafka broker | 3.x, 4.x |
Kafka is only required when running in distributed mode (-usekafka). Local mode uses in-memory queues and has no Kafka dependency.
Operating Systems
| OS | Status |
|---|---|
| Linux | Supported; used in production deployments |
| macOS | Supported; tested in CI |
| Windows | Not officially tested |
License
Apache License, Version 2.0. See LICENSE in the repository.
9 - Troubleshooting
If something isn’t working, read logs first. Lucille logs are detailed and will usually identify where the problem is coming from. See Log Analysis for a guide to reading Lucille logs.
Debugging Failed Documents
The run summary reports how many documents failed, but not which ones or why. Here’s the workflow for investigating failures.
Step 1: Find the failed document IDs and reasons
Search the logs for failure messages. These are logged at ERROR level by the DocLogger. All document failures use a standardized "Document FAILED" prefix, so you can find every failure in one pass and then drill into specific types:
# All document failures (any cause)
grep "Document FAILED" lucille.log

# Pipeline failures (a stage threw StageException)
grep "Document FAILED during pipeline processing:" lucille.log

# Indexer failures (search backend rejected the document)
grep "Document FAILED during indexing:" lucille.log

# Poison pills (distributed mode — exceeded worker.maxRetries)
grep "Document FAILED: retry count exceeded" lucille.log
Each pipeline failure is followed by a stack trace identifying the stage and exception. Each indexer failure includes the backend’s rejection reason. See Which documents failed? for more detail.
Step 2: Understand the failure reason
Common causes:
| Failure type | Typical reasons |
|---|---|
Pipeline (StageException) | Required field missing, external service unavailable, malformed data the stage can’t parse |
| Indexer (backend rejection) | Field type mismatch with index mapping, document too large, version conflict |
| Poison pill (distributed mode) | Document causes a Worker crash repeatedly — often an out-of-memory condition or a bug in a stage |
If the reason is clear from the error message (e.g., “field X is missing”), fix the pipeline config or source data and re-run.
Step 3: Inspect the document’s contents
If you need to see what fields and values the document had at the point of failure:
Add a Print stage before the failing stage. Print logs document contents to a file or stdout. Use conditions to limit output to the specific document:
{
  class: "com.kmwllc.lucille.stage.Print"
  conditions: [{ fields: ["id"], values: ["the-failing-doc-id"] }]
}
Re-run with a CSV indexer. Swap your indexer to CSV and re-run. Documents that would have been rejected by the real backend are written to the CSV file where you can inspect their fields. This helps with indexer rejections but not pipeline failures (the document never reaches the indexer if a stage throws).
indexer { type: "CSV" }
csv { path: "./debug-output.csv", columns: ["id", "title", "problematic_field"] }
Re-run in test mode (Java). Use Runner.runInTestMode() with the same config and source data. After the run, inspect documents programmatically:
RunResult result = Runner.runInTestMode(config);
List<Document> docs = result.getDocsSentForIndexing("my-connector");
Document problem = docs.stream()
    .filter(d -> d.getId().equals("the-failing-doc-id"))
    .findFirst().orElse(null);
Consume the Kafka fail topic (distributed mode). Documents that exceeded worker.maxRetries are sent to the {pipeline}_fail topic with their full serialized content. Consume the topic to inspect the document.
Step 4: Fix and verify
Once you understand the cause:
- Missing or malformed field — add a stage earlier in the pipeline to clean or populate the field, or add conditions so the failing stage skips documents without the required data.
- Index mapping mismatch — update the index mapping to accept the field type, or add a stage to convert the field to the expected type.
- Stage bug — fix the stage code and add a test case for the problematic input.
Re-run with the fix and confirm the failure count drops to zero in the run summary.
Build & Java Environment Issues
Java Command Not Found / Wrong Version
Symptoms:
- java: command not found.
- Lucille fails with version errors.
Fix:
- Ensure Java 17+ is installed and on
PATH. - Ensure
JAVA_HOMEpoints to a JDK (not a JRE).
java -version
echo $JAVA_HOME
Example output:
java -version

java version "22.0.1" 2024-04-16
Java(TM) SE Runtime Environment (build 22.0.1+8-16)
Java HotSpot(TM) 64-Bit Server VM (build 22.0.1+8-16, mixed mode, sharing)

echo $JAVA_HOME

/Library/Java/JavaVirtualMachines/jdk-22.jdk/Contents/Home
If unset, refer to the installation guide.
Configuration Issues
Missing or Misspelled Keys
Symptoms:
- Configuration does not contain key “name”.
- Stage/Indexer throws for missing required property.
Fix:
- Compare with component
SPECdocs and ensure required fields exist and are correctly cased.
Invalid Types or List/Map Shapes
Symptoms:
- Expected NUMBER got STRING.
Fix:
- Match the
SPECtype exactly and convert scalars to lists/maps when required.
Kafka / Messaging
Cannot Connect to Kafka
Symptoms:
- Timed out waiting for connection from Kafka.
- Connection to Kafka could not be established.
Fix:
- Verify your
kafka.bootstrapServersin your config. - Check Kafka connectivity to ensure it is reachable.
Solr / Elasticsearch / OpenSearch Connectivity
Cannot Connect to Solr / Elasticsearch / OpenSearch
Symptoms:
- Failed to talk to the search cluster.
- Connection refused or host not found.
Fix:
- Ensure that the URL/port in your config is correct.
- Ensure that the service is reachable from the machine running Lucille.
Certificate / Authorization Problems
Symptoms:
- Handshake failure, certificate not trusted, or unauthorized.
Fix:
- Test connection with auth/TLS disabled for debugging.
- Verify that credentials are correct.
Schema / Mapping mismatches
Symptoms:
- Bulk index partially fails and some documents are rejected.
- Mapping or parsing exceptions.
Fix:
- Read the exact field and reason in the error details and fix that field in your pipeline or mapping.
Timeouts
Lucille has a default timeout specified in runner.connectorTimeout of 24 hours. You can override this timeout in the configuration file. This may be necessary in the case of very large or long-running jobs that may take more than 24 hours to complete.